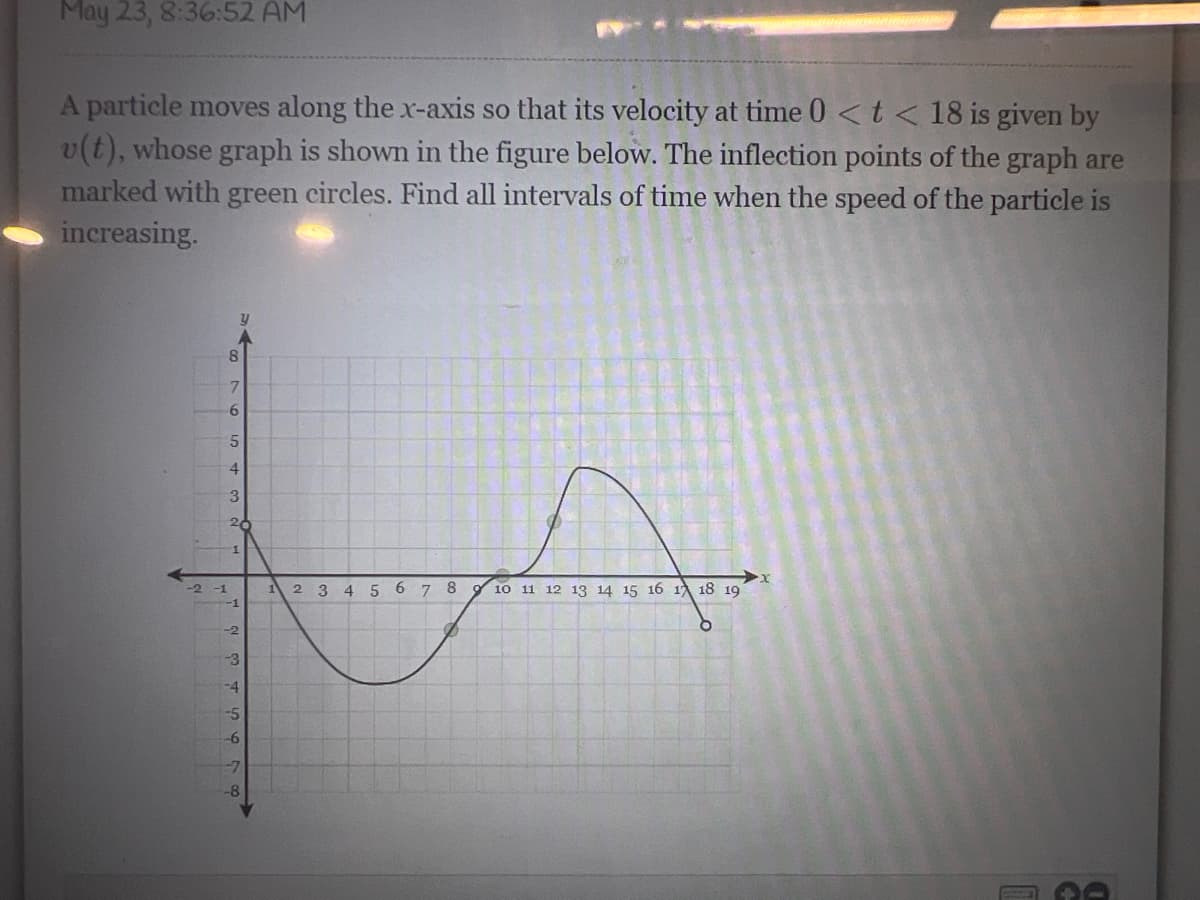
May 23, 8:36:52 AM A particle moves along the x-axis so that its velocity at time 0 < t < 18 is given by v(t), whose graph is shown in the figure below. The inflection points of the graph are marked with green circles. Find all intervals of time when the speed of the particle is increasing.
May 23, 8:36:52 AM A particle moves along the x-axis so that its velocity at time 0 < t < 18 is given by v(t), whose graph is shown in the figure below. The inflection points of the graph are marked with green circles. Find all intervals of time when the speed of the particle is increasing.

Algebra & Trigonometry with Analytic Geometry
13th Edition
ISBN:9781133382119
Author:Swokowski
Publisher:Swokowski
Chapter2: Equations And Inequalities
Section2.7: More On Inequalities
Problem 44E

Related questions
Question
Transcribed Image Text:May 23, 8:36:52 AM
A particle moves along the x-axis so that its velocity at time 0 < t < 18 is given by
v(t), whose graph is shown in the figure below. The inflection points of the graph are
marked with green circles. Find all intervals of time when the speed of the particle is
increasing.
y
2 3 4567 8
10 11 12 13 14 15 16 17 18 19
O
-2
-1
8
7
6
5
3
20
1
NH
-2
-3
7
-4
-5
-6
-7
-8
Expert Solution
This question has been solved!
Explore an expertly crafted, step-by-step solution for a thorough understanding of key concepts.

Step by step
Solved in 2 steps

Recommended textbooks for you
Algebra & Trigonometry with Analytic Geometry
Algebra
ISBN:
9781133382119
Author:
Swokowski
Publisher:
Cengage

Mathematics For Machine Technology
Advanced Math
ISBN:
9781337798310
Author:
Peterson, John.
Publisher:
Cengage Learning,
Algebra & Trigonometry with Analytic Geometry
Algebra
ISBN:
9781133382119
Author:
Swokowski
Publisher:
Cengage
Mathematics For Machine Technology
Advanced Math
ISBN:
9781337798310
Author:
Peterson, John.
Publisher:
Cengage Learning,