Mean=3.003 SD -0.058 Num samples=100 2.80 2.90 3 3.10 Sample means A certain fast-food location claims that the average (mean) wait time in the drive-thru lane is 3 minutes. One customer thinks that the average wait time is actually longer than that, and so the customer takes a random sample of drive-thru lane wait times. The customer observes 72 transactions, and the average (mean) wait time for these 72 transactions is 3.6 minutes. In order to conduct a statistical analysis, an applet was used to see if the candidate's claim is plausible. Use the distribution of 100 simulated statistics generated by the applet (pictured above) to answer the questions. a) There are 100 little squares in the simulated distribution. What does each little square represent? O The average wait time of a sample of 72 drive thru transactions if we assume that the average wait time for all transactions is atually 3 minutes. The average wait time of a sample of 100 drive thru transactions if we assume that the average wait time for all transactions is atually 3 minutes. O The average wait time of a sample of 72 drive thru transactions if we assume that the average wait time for all transactions is atually 3.6 minutes. The average wait time of a sample of 72 drive thru transactions if we don't know the average wait time for all transactions. 10 0
Mean=3.003 SD -0.058 Num samples=100 2.80 2.90 3 3.10 Sample means A certain fast-food location claims that the average (mean) wait time in the drive-thru lane is 3 minutes. One customer thinks that the average wait time is actually longer than that, and so the customer takes a random sample of drive-thru lane wait times. The customer observes 72 transactions, and the average (mean) wait time for these 72 transactions is 3.6 minutes. In order to conduct a statistical analysis, an applet was used to see if the candidate's claim is plausible. Use the distribution of 100 simulated statistics generated by the applet (pictured above) to answer the questions. a) There are 100 little squares in the simulated distribution. What does each little square represent? O The average wait time of a sample of 72 drive thru transactions if we assume that the average wait time for all transactions is atually 3 minutes. The average wait time of a sample of 100 drive thru transactions if we assume that the average wait time for all transactions is atually 3 minutes. O The average wait time of a sample of 72 drive thru transactions if we assume that the average wait time for all transactions is atually 3.6 minutes. The average wait time of a sample of 72 drive thru transactions if we don't know the average wait time for all transactions. 10 0

Glencoe Algebra 1, Student Edition, 9780079039897, 0079039898, 2018
18th Edition
ISBN:9780079039897
Author:Carter
Publisher:Carter
Chapter10: Statistics
Section10.5: Comparing Sets Of Data
Problem 3BGP

Related questions
Question
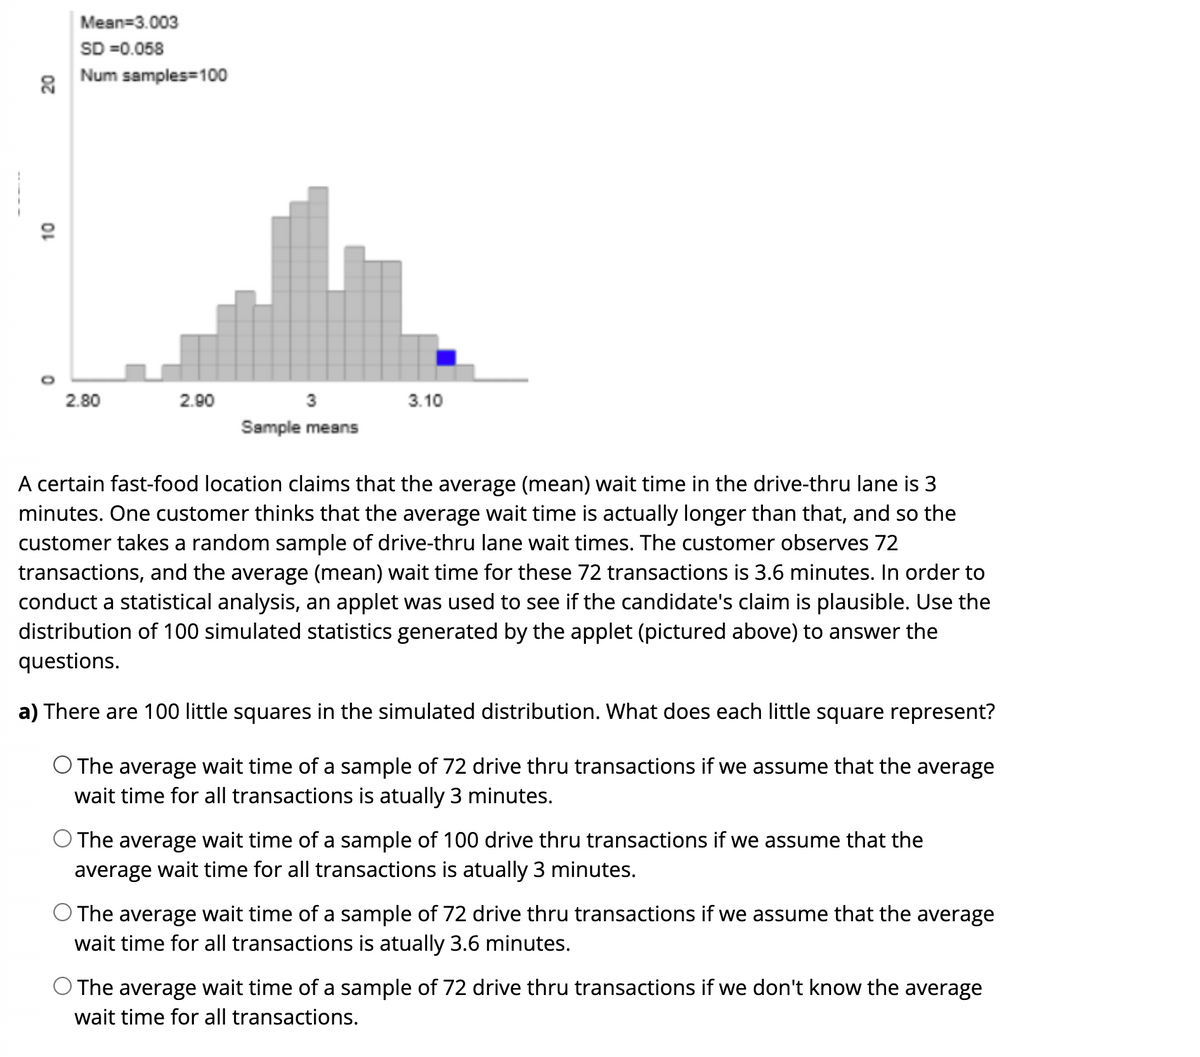
Transcribed Image Text:Mean=3.003
SD =0.058
Num samples=100
2.80
2.90
3
3.10
Sample means
A certain fast-food location claims that the average (mean) wait time in the drive-thru lane is 3
minutes. One customer thinks that the average wait time is actually longer than that, and so the
customer takes a random sample of drive-thru lane wait times. The customer observes 72
transactions, and the average (mean) wait time for these 72 transactions is 3.6 minutes. In order to
conduct a statistical analysis, an applet was used to see if the candidate's claim is plausible. Use the
distribution of 100 simulated statistics generated by the applet (pictured above) to answer the
questions.
a) There are 100 little squares in the simulated distribution. What does each little square represent?
O The average wait time of a sample of 72 drive thru transactions if we assume that the average
wait time for all transactions is atually 3 minutes.
The average wait time of a sample of 100 drive thru transactions if we assume that the
average wait time for all transactions is atually 3 minutes.
O The average wait time of a sample of 72 drive thru transactions if we assume that the average
wait time for all transactions is atually 3.6 minutes.
The average wait time of a sample of 72 drive thru transactions if we don't know the average
wait time for all transactions.
20
10
Transcribed Image Text:b) Which of the following conclusions is the most accurate to make based on the observed statistic?
Because our statistic is unusual/unexpected, we have strong evidence that the average wait
time at the restaurant is more than 3 minutes.
We conclude that the average wait time at the restaurant is 3.6 minutes.
O We conclude that the average wait time at the restaurant is 3 minutes.
Because our statistic is usual/expected, it is plausible that the average wait time for customers
at the fast food restaurant is 3 minutes.
Expert Solution
This question has been solved!
Explore an expertly crafted, step-by-step solution for a thorough understanding of key concepts.

This is a popular solution!

Trending now
This is a popular solution!

Step by step
Solved in 3 steps

Recommended textbooks for you
Glencoe Algebra 1, Student Edition, 9780079039897…
Algebra
ISBN:
9780079039897
Author:
Carter
Publisher:
McGraw Hill
Glencoe Algebra 1, Student Edition, 9780079039897…
Algebra
ISBN:
9780079039897
Author:
Carter
Publisher:
McGraw Hill