Measures of Variation 
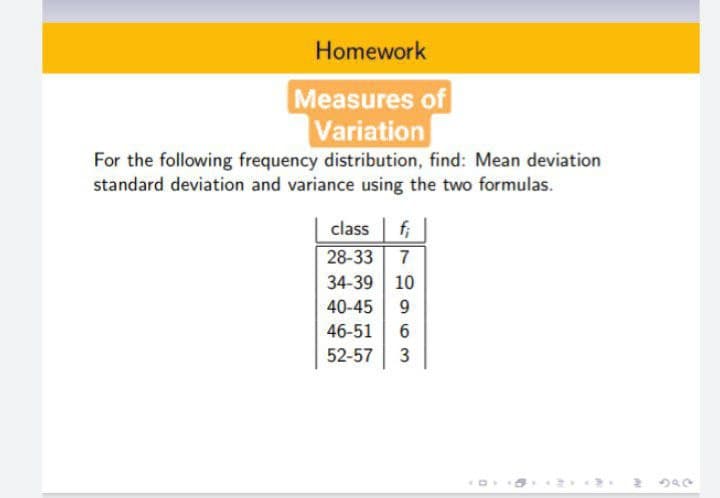
For the following frequency distribution, find: Mean deviation standard deviation and variance using the two formulas. class | f 28-33 7 34-39 10 40-45 9. 46-51 52-57 3
Q: Find range, quartile deviation C.I. 25-30 30-35 35-40 40-45 45-50 50-55 55-60 60-65…
A: Since you have asked multiple question, we will solve the first question for you. If youwant any…
Q: Closing prices of two stocks are recorded for 50 trading days. The sample standard deviation of…
A: It is given that the sample size is n=50. The sample standard deviation of stock X is sx=4.897. The…
Q: Pupils Per Teacher The frequency distribution shows the average number of pupils per teacher in some…
A:
Q: Calculate the range, variance, standard deviation, and coefficient of variatio of the given…
A: Range is the difference between the highest and the lowest number in the observation Standard…
Q: Score Use the display of data to find the standard deviation. 12- 10- 8- 6- 4- 2- 5 6 7 8 9 10 11…
A: Solution: The histogram for the scores is given.
Q: Class Frequency :Q3) For the following data 80-84 3 50-54 55-59 60-64 65-69 70-74 75-79 3 7 10 16 12…
A: Let x denote the mid-point and f denote the frequencies.
Q: Value: Frequency: Calculate the mean and standard deviation from the following data: 80-89 50-59…
A: Given that: Value: 90-99 80-89 70-79 60-69 50-59 40-49 30-39 Frequency 2 12 22 20 14 4 1
Q: profit $ number of days 10-24 2 25-39 6 40-54 8…
A: Formulae: For a grouped data with k classes having class marks xi, class frequency fi (i = 1, 2, …,…
Q: Intelligence quotas on two different tests are normally distributed. Test A has a mean of 100 and a…
A: Pls follow step 2nd . Option A is correct.
Q: Class Frequenc 16-23 10 24-31 32-39 40-47 48-55 17 13 56-63 3 Σ 55 count: a. Standard Deviation…
A:
Q: A frequency distribution gives the following results : () Coefficient of variation = 5 (ii) Standard…
A:
Q: Question * Test scores for a given class are normally distributed with a mean of 80 and standard…
A: Let X be the test scores from normal distribution with mean (μ) = 80 and standard deviation (σ) =…
Q: Frequency distribution of marks obtained by 90 students is given below. Compute: (a) Arithmetic…
A: Answer: For this computation first we compute mid-points of each class interval. And take the…
Q: Cost per Load of Laundry Detergents The costs per load (in cents) of 35 laundry detergents tested by…
A: Measured of dispersion measures the spread of the data. Standard deviation and variance are 2…
Q: The coefficient of variation CV describes the standard deviation as a percent of the mean. Because…
A: Given Information: The coefficient of variation CV describes the standard deviation as a percent of…
Q: Drag and drop the correct numbers to build a normal distribution graph based on a mean of 70 and a…
A: We have to fill given blanks.
Q: Class interval Tally Frequency x(weight in kg) 40 - 44 45 - 49 50 - 54 55 - 59 60 - 64 65 - 69 70 -…
A: Class Interval Freuqency(f) Mid point(M) fM fM2 40-44 2 42 84 3528 45-49 4 47 188 8836 50-54 5…
Q: Frequency distributions for both pretest and posttest scores are presented below. Use this…
A: Solution: firstly calculate mean and Standard Deviation(SD) of data using excel : For pretest:…
Q: weight of filled bags [g] an automatic filling. 56 158 154 133 141 130 144 137 51 146 156 138 138…
A:
Q: Pupils Per Teacher The frequency distribution shows the average number of pupils per teacher in some…
A: From the given information,
Q: Interval Frequency A sample of 27 households from a survey generates the following frequency table…
A: Solution To find the sample mean and sd we will find first mid points.
Q: Age (years) Frequency 20≤x<30 160 30≤x<40 130 40≤x<50 100 50≤x<60 115 60≤x<70 125 70≤x<80 135 The…
A: (a) Construct the Histogram for the distribution of ages. From the information, given that Use…
Q: II. Frequency Distribution Table. Solve the mean and complete the table below. Class Frequency…
A: The distribution table is given with frequencies.
Q: A frequency distribution gives the following results () Coefficient of variation = 5 (ii) Standard…
A: Given,coefficient of variation=5standard deviation(SD)=2karl pearson's coefficient of skewness=0.5
Q: Pupils Per Teacher The frequency distribution shows the average number of pupils per teacher in some…
A: Hey, since there are multiple questions posted, we will answer first question. If you want any…
Q: A. Use the frequency distribution below to answer the following questions. Scores of students in a…
A: Introduction: Quartiles: Quartiles are used to divide the data. There are three types of quartiles:…
Q: Intelligence quotas on two different tests are normally distributed. Test A has a mean of 100 and a…
A:
Q: Intelligence quotas on two different tests are normally distributed. Test A has a mean of 100 and a…
A: In this question, it has been given that two different tests A and B are normally distributed, Test…
Q: Pupils Per Teacher The frequency distribution shows the average number of pupils per teacher in some…
A:
Q: Coffee With Meals: A researcher wishes to determine the number of cups of coffee a customer drinks…
A:
Q: Stem-and-leaf of Data: Amount of Money earned in a day in dollars Leaf Unit = 10 N = * 2…
A: Given information: Leaf Unit = 10 The stem-and-leaf plot is as follows:…
Q: 12-20 8 21-29 7 30-38 3 39-47 5 48-56 0 57-65 0 66-74 1 Class size = 6 Class Interval =…
A:
Q: data is from a sample. Calculate the mean, standard deviation, and variance. x 23.1 47.5 35.8 12.5…
A:
Q: Test scores for a given class are normally distributed with a mean of 80 and standard deviation 10.…
A:
Q: Sample A: Sample B: Sample C: 4, 9, 14 75, 8e, 85 1,870; 1,875; 1,880 (a) Find the mean and standard…
A: Sample A: 4,9,14 Sample B: 75,80,85 Sample C: 1070,1075,1080 We need to calculate standard deviation…
Q: find the mean, variance and standard deviation.
A:
Q: "Measures of Variation" 1. The amount of time (in minutes) that a sample of students spends watching…
A: Standard deviation: For a set of n observations, x1, x2, ... , xn, standard deviation is given by,…
Q: Stem-and-leaf of Data: Amount of Money earned in a day in dollars Leaf Unit = 10 N = 59 3 234 13 3…
A: Note: Hi there! Thank you for posting the question. As there are multiple sub parts, according to…
Q: Saved Consider the following sample data. Sample A: Sample B: Sample C: 9, 18, 27 79, 88, 97 1,090;…
A: The means and standard deviations of the three samples are calculated using MINITAB software and the…
Q: STATISTICS The following distribution is about the dsconnection time of internrt due to heavy…
A: Given: Disconnection Time Number of days (f) Lower limit Upper limit 0 3 6 3 6 9 6 12…
Q: This data is from a sample. Calculate the mean, standard deviation, and coefficient of variation.…
A:
Q: he distribution of the number of hours that a random sample of people spend doing chores per week is…
A:
Q: estion Let X follows normal distribution with mean and variance o², find P(|X− µ|<20). a) b) c) d)…
A: Given that X follows normal distribution with mean µ and variance σ2 It is asked to find PX-μ<2σ…
Q: Passenger Vehicle Deaths The number of people killed in each state from passenger vehicle crashes…
A:
Q: The normal distribution plays an important role in statistics. Write a brief description on each of…
A: The normal or the Gaussian distribution plays an important role in statistics. (i) The key features…
Q: Intelligence quotas on two different tests are normally distributed. Test A has a mear and a…
A: Given data,For Team AMean μ=100sd σ=16Individual score is x=132For Team BMean μ=100sd…
Q: Cigarette Taxes The increases (in cents) in cigarette taxes for 14 states in a 6-month period are…
A: The range of a data set is the difference between the maximum data value and the minimum data value.…
Q: Mean Devia 4 Example 9. Find the Median and Mean Deviation of the following data. Also calculate…
A:
Q: distribution of Husband's (X) and Wife's (Y) incomes, both in 1,000 US$, respectively: P(X) Y P(Y)…
A: The formula to compute the expected values is, The formula to compute the standard deviation is,
Q: Intelligence quotas on two different tests are normally distributed. Test A has a mean of 100 and a…
A: Given: For test A: x=130, μ=100 and σ=13 and for test B: x=121, μ=100 and σ=15. To find: Which…
Step by step
Solved in 2 steps with 2 images