he distribution of the number of hours that a random sample of people spend doing chores per week is shown in the pie chart. Use 32 as the midpoint for "30+ hours." ake a frequency distribution for the data. Then use the table to estimate the sample mean and the sample standard deviation of the data set. Click the icon to view the pie chart. rst construct the frequency distribution. Class Frequency, f 0-4 3 5-9 12 10-14 26 15-19 21 20-24 14 25-29 12 30+ 4
he distribution of the number of hours that a random sample of people spend doing chores per week is shown in the pie chart. Use 32 as the midpoint for "30+ hours." ake a frequency distribution for the data. Then use the table to estimate the sample mean and the sample standard deviation of the data set. Click the icon to view the pie chart. rst construct the frequency distribution. Class Frequency, f 0-4 3 5-9 12 10-14 26 15-19 21 20-24 14 25-29 12 30+ 4

Glencoe Algebra 1, Student Edition, 9780079039897, 0079039898, 2018
18th Edition
ISBN:9780079039897
Author:Carter
Publisher:Carter
Chapter10: Statistics
Section10.3: Measures Of Spread
Problem 16HP

Related questions
Question
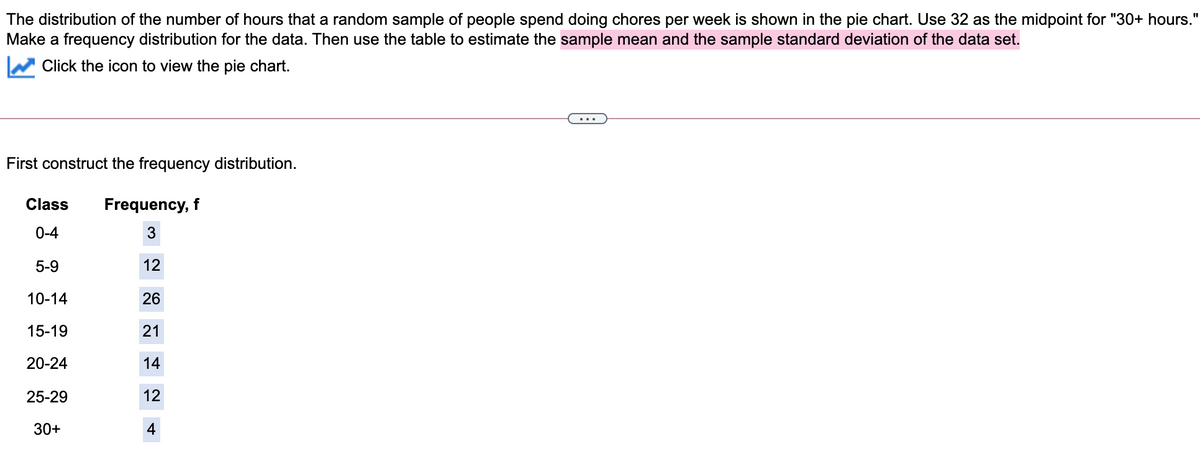
Transcribed Image Text:The distribution of the number of hours that a random sample of people spend doing chores per week is shown in the pie chart. Use 32 as the midpoint for "30+ hours."
Make a frequency distribution for the data. Then use the table to estimate the sample mean and the sample standard deviation of the data set.
Click the icon to view the pie chart.
First construct the frequency distribution.
Class
Frequency, f
0-4
5-9
12
10-14
26
15-19
21
20-24
14
25-29
12
30+
4
Expert Solution
This question has been solved!
Explore an expertly crafted, step-by-step solution for a thorough understanding of key concepts.

This is a popular solution!

Trending now
This is a popular solution!

Step by step
Solved in 2 steps with 2 images

Recommended textbooks for you
Glencoe Algebra 1, Student Edition, 9780079039897…
Algebra
ISBN:
9780079039897
Author:
Carter
Publisher:
McGraw Hill

Big Ideas Math A Bridge To Success Algebra 1: Stu…
Algebra
ISBN:
9781680331141
Author:
HOUGHTON MIFFLIN HARCOURT
Publisher:
Houghton Mifflin Harcourt
Glencoe Algebra 1, Student Edition, 9780079039897…
Algebra
ISBN:
9780079039897
Author:
Carter
Publisher:
McGraw Hill
Big Ideas Math A Bridge To Success Algebra 1: Stu…
Algebra
ISBN:
9781680331141
Author:
HOUGHTON MIFFLIN HARCOURT
Publisher:
Houghton Mifflin Harcourt