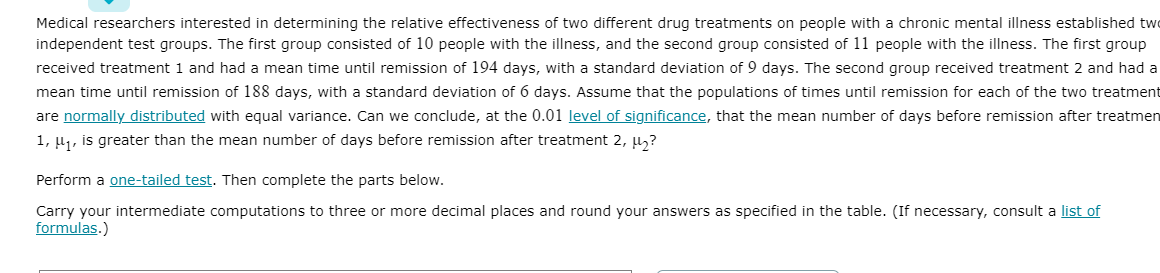
Medical researchers interested in determining the relative effectiveness of two different drug treatments on people with a chronic mental illness established tw independent test groups. The first group consisted of 10 people with the illness, and the second group consisted of 11 people with the illness. The first group received treatment 1 and had a mean time until remission of 194 days, with a standard deviation of 9 days. The second group received treatment 2 and had mean time until remission of 188 days, with a standard deviation of 6 days. Assume that the populations of times until remission for each of the two treatmer are normally distributed with equal variance. Can we conclude, at the 0.01 level of significance, that the mean number of days before remission after treatme 1, µ1, is greater than the mean number of days before remission after treatment 2, µ? Perform a one-tailed test. Then complete the parts below. Carry your intermediate computations to three or more decimal places and round your answers as specified in the table. (If necessary, consult a list of formulas.)
Medical researchers interested in determining the relative effectiveness of two different drug treatments on people with a chronic mental illness established tw independent test groups. The first group consisted of 10 people with the illness, and the second group consisted of 11 people with the illness. The first group received treatment 1 and had a mean time until remission of 194 days, with a standard deviation of 9 days. The second group received treatment 2 and had mean time until remission of 188 days, with a standard deviation of 6 days. Assume that the populations of times until remission for each of the two treatmer are normally distributed with equal variance. Can we conclude, at the 0.01 level of significance, that the mean number of days before remission after treatme 1, µ1, is greater than the mean number of days before remission after treatment 2, µ? Perform a one-tailed test. Then complete the parts below. Carry your intermediate computations to three or more decimal places and round your answers as specified in the table. (If necessary, consult a list of formulas.)

MATLAB: An Introduction with Applications
6th Edition
ISBN:9781119256830
Author:Amos Gilat
Publisher:Amos Gilat
Chapter1: Starting With Matlab
Section: Chapter Questions
Problem 1P

Related questions

Topic Video
Question
| (a) | State the null hypothesis
H0
H1
|
|
|
H0:
|
||
|
H1:
|
||
| (b) | Determine the type of test statistic to use. | |
| ▼(Choose one) |
|
|
| (c) | Find the value of the test statistic. (Round to three or more decimal places.) | |
|
|
||
| (d) | Find the p-value. (Round to three or more decimal places.) | |
|
|
||
| (e) | Can we conclude that the |
|
|
|
Transcribed Image Text:Medical researchers interested in determining the relative effectiveness of two different drug treatments on people with a chronic mental illness established two
independent test groups. The first group consisted of 10 people with the illness, and the second group consisted of 11 people with the illness. The first group
received treatment 1 and had a mean time until remission of 194 days, with a standard deviation of 9 days. The second group received treatment 2 and had a
mean time until remission of 188 days, with a standard deviation of 6 days. Assume that the populations of times until remission for each of the two treatment
are normally distributed with equal variance. Can we conclude, at the 0.01 level of significance, that the mean number of days before remission after treatmen
1, u1, is greater than the mean number of days before remission after treatment 2, µ,?
Perform a one-tailed test. Then complete the parts below.
Carry your intermediate computations to three or more decimal places and round your answers as specified in the table. (If necessary, consult a list of
formulas.)
Expert Solution
This question has been solved!
Explore an expertly crafted, step-by-step solution for a thorough understanding of key concepts.

This is a popular solution!

Trending now
This is a popular solution!

Step by step
Solved in 2 steps

Knowledge Booster


Learn more about
Need a deep-dive on the concept behind this application? Look no further. Learn more about this topic, statistics and related others by exploring similar questions and additional content below.Recommended textbooks for you
MATLAB: An Introduction with Applications
Statistics
ISBN:
9781119256830
Author:
Amos Gilat
Publisher:
John Wiley & Sons Inc

Probability and Statistics for Engineering and th…
Statistics
ISBN:
9781305251809
Author:
Jay L. Devore
Publisher:
Cengage Learning

Statistics for The Behavioral Sciences (MindTap C…
Statistics
ISBN:
9781305504912
Author:
Frederick J Gravetter, Larry B. Wallnau
Publisher:
Cengage Learning
MATLAB: An Introduction with Applications
Statistics
ISBN:
9781119256830
Author:
Amos Gilat
Publisher:
John Wiley & Sons Inc
Probability and Statistics for Engineering and th…
Statistics
ISBN:
9781305251809
Author:
Jay L. Devore
Publisher:
Cengage Learning
Statistics for The Behavioral Sciences (MindTap C…
Statistics
ISBN:
9781305504912
Author:
Frederick J Gravetter, Larry B. Wallnau
Publisher:
Cengage Learning

Elementary Statistics: Picturing the World (7th E…
Statistics
ISBN:
9780134683416
Author:
Ron Larson, Betsy Farber
Publisher:
PEARSON

The Basic Practice of Statistics
Statistics
ISBN:
9781319042578
Author:
David S. Moore, William I. Notz, Michael A. Fligner
Publisher:
W. H. Freeman

Introduction to the Practice of Statistics
Statistics
ISBN:
9781319013387
Author:
David S. Moore, George P. McCabe, Bruce A. Craig
Publisher:
W. H. Freeman