Model Std. Error Beta Sig. 1 (Constant) .538 .208 2.591 .01% Highest year of school -064 .011 -113 -5.763 .00 completed Respondents sex .161 .063 .048 2.581 .01 Number of brothers and .086 .011 .146 7.553 .00 sisters Size of place in 1000s -4.885E-5 .000 -.034 -1.833 .06 Age of respondent 031 002 337 17 932 00
Model Std. Error Beta Sig. 1 (Constant) .538 .208 2.591 .01% Highest year of school -064 .011 -113 -5.763 .00 completed Respondents sex .161 .063 .048 2.581 .01 Number of brothers and .086 .011 .146 7.553 .00 sisters Size of place in 1000s -4.885E-5 .000 -.034 -1.833 .06 Age of respondent 031 002 337 17 932 00

MATLAB: An Introduction with Applications
6th Edition
ISBN:9781119256830
Author:Amos Gilat
Publisher:Amos Gilat
Chapter1: Starting With Matlab
Section: Chapter Questions
Problem 1P

Related questions
Question
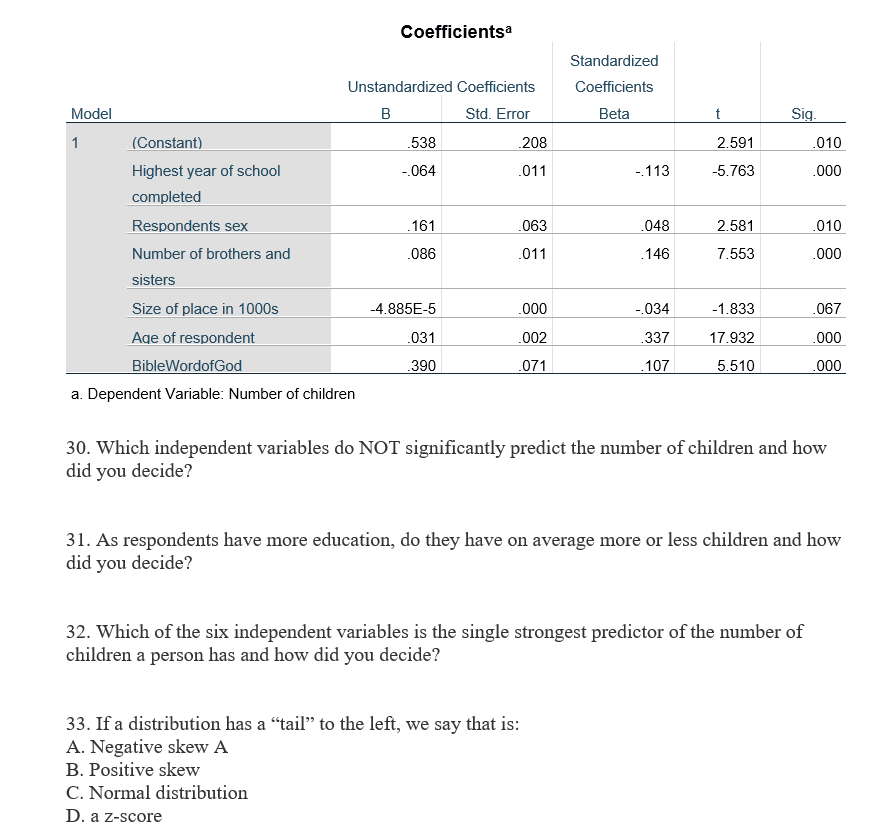
Transcribed Image Text:Coefficientsa
Standardized
Unstandardized Coefficients
Coefficients
Model
B
Std. Error
Beta
t
Sig.
1
(Constant)
538
.208
2.591
.010
Highest year of school
-.064
.011
-113
-5.763
.000
completed
Respondents sex
.161
.063
.048
2.581
.010
Number of brothers and
.086
.011
.146
7.553
.000
sisters
Size of place in 1000s
-4.885E-5
.000
-034
-1.833
.067
Age of respondent
.031
002
.337
17.932
.000
BibleWordofGod
390
.071
.107
5.510
.000
a. Dependent Variable: Number of children
30. Which independent variables do NOT significantly predict the number of children and how
did you decide?
31. As respondents have more education, do they have on average more or less children and how
did you decide?
32. Which of the six independent variables is the single strongest predictor of the number of
children a person has and how did you decide?
33. If a distribution has a "tail" to the left, we say that is:
A. Negative skew A
B. Positive skew
C. Normal distribution
D. a z-score
Expert Solution
This question has been solved!
Explore an expertly crafted, step-by-step solution for a thorough understanding of key concepts.

Step by step
Solved in 2 steps with 1 images

Recommended textbooks for you
MATLAB: An Introduction with Applications
Statistics
ISBN:
9781119256830
Author:
Amos Gilat
Publisher:
John Wiley & Sons Inc

Probability and Statistics for Engineering and th…
Statistics
ISBN:
9781305251809
Author:
Jay L. Devore
Publisher:
Cengage Learning

Statistics for The Behavioral Sciences (MindTap C…
Statistics
ISBN:
9781305504912
Author:
Frederick J Gravetter, Larry B. Wallnau
Publisher:
Cengage Learning
MATLAB: An Introduction with Applications
Statistics
ISBN:
9781119256830
Author:
Amos Gilat
Publisher:
John Wiley & Sons Inc
Probability and Statistics for Engineering and th…
Statistics
ISBN:
9781305251809
Author:
Jay L. Devore
Publisher:
Cengage Learning
Statistics for The Behavioral Sciences (MindTap C…
Statistics
ISBN:
9781305504912
Author:
Frederick J Gravetter, Larry B. Wallnau
Publisher:
Cengage Learning

Elementary Statistics: Picturing the World (7th E…
Statistics
ISBN:
9780134683416
Author:
Ron Larson, Betsy Farber
Publisher:
PEARSON

The Basic Practice of Statistics
Statistics
ISBN:
9781319042578
Author:
David S. Moore, William I. Notz, Michael A. Fligner
Publisher:
W. H. Freeman

Introduction to the Practice of Statistics
Statistics
ISBN:
9781319013387
Author:
David S. Moore, George P. McCabe, Bruce A. Craig
Publisher:
W. H. Freeman