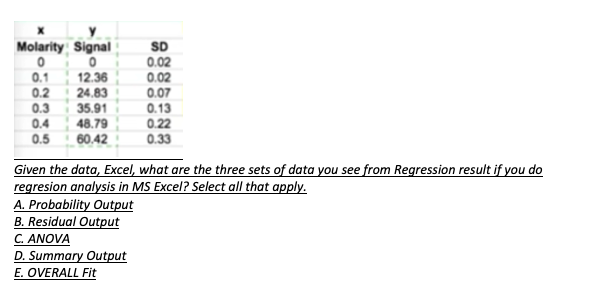
Molarity Signal 0 0 0.1 12.36 0.2 24.83 ! 0.3 35.91 0.4 48.79 0.5 60.42 Given the data, Excel, what are the three sets of data you see from Regression result if you do regresion analysis in MS Excel? Select all that apply. A. Probability Output B. Residual Output C. ANOVA SD 0.02 0.02 0.07 0.13 0.22 0.33 D. Summary Output E. OVERALL Fit
Molarity Signal 0 0 0.1 12.36 0.2 24.83 ! 0.3 35.91 0.4 48.79 0.5 60.42 Given the data, Excel, what are the three sets of data you see from Regression result if you do regresion analysis in MS Excel? Select all that apply. A. Probability Output B. Residual Output C. ANOVA SD 0.02 0.02 0.07 0.13 0.22 0.33 D. Summary Output E. OVERALL Fit

Glencoe Algebra 1, Student Edition, 9780079039897, 0079039898, 2018
18th Edition
ISBN:9780079039897
Author:Carter
Publisher:Carter
Chapter10: Statistics
Section10.1: Measures Of Center
Problem 9PPS

Related questions
Question
Transcribed Image Text:Molarity Signal
0
0
0.1
12.36
0.2
24.83
0.3
35.91
0.4
48.79
0.5 60.42
A. Probability Output
B. Residual Output
C. ANOVA
SD
0.02
0.02
0.07
Given the data, Excel, what are the three sets of data you see from Regression result if you do
regresion analysis in MS Excel? Select all that apply.
D. Summary Output
E. OVERALL Fit
0.13
0.22
0.33
Expert Solution
This question has been solved!
Explore an expertly crafted, step-by-step solution for a thorough understanding of key concepts.

Step by step
Solved in 2 steps

Recommended textbooks for you
Glencoe Algebra 1, Student Edition, 9780079039897…
Algebra
ISBN:
9780079039897
Author:
Carter
Publisher:
McGraw Hill
Glencoe Algebra 1, Student Edition, 9780079039897…
Algebra
ISBN:
9780079039897
Author:
Carter
Publisher:
McGraw Hill