month tail Milk P milk for s er gallon listed in the ed in kn price for Conference on Social Robotics, Vol. 6414, 2010 (adapted from Figure 2). 6.32 Hospital length of stay. Health insurers and the federal gov- ernment are both putting pressure on hospitals to shorten the average length of stay (LOS) of their patients. The aver- age LOS in the United States is 4.6 days (Healthcare Cost and Utilization Project Statistical Brief, December 2018). A random sample of 20 hospitals in one state had a mean LOS of 3.8 days and a standard deviation of 1.2 days. a. Use a 90% confidence interval to estimate the popula- tion mean LOS for the state's hospitals. h. Internot th 1: torn of this application. a. b. 6.35 O ar
month tail Milk P milk for s er gallon listed in the ed in kn price for Conference on Social Robotics, Vol. 6414, 2010 (adapted from Figure 2). 6.32 Hospital length of stay. Health insurers and the federal gov- ernment are both putting pressure on hospitals to shorten the average length of stay (LOS) of their patients. The aver- age LOS in the United States is 4.6 days (Healthcare Cost and Utilization Project Statistical Brief, December 2018). A random sample of 20 hospitals in one state had a mean LOS of 3.8 days and a standard deviation of 1.2 days. a. Use a 90% confidence interval to estimate the popula- tion mean LOS for the state's hospitals. h. Internot th 1: torn of this application. a. b. 6.35 O ar

MATLAB: An Introduction with Applications
6th Edition
ISBN:9781119256830
Author:Amos Gilat
Publisher:Amos Gilat
Chapter1: Starting With Matlab
Section: Chapter Questions
Problem 1P

Related questions
Question
Use the information in Ex 6.32 to find the 95% CI for the population
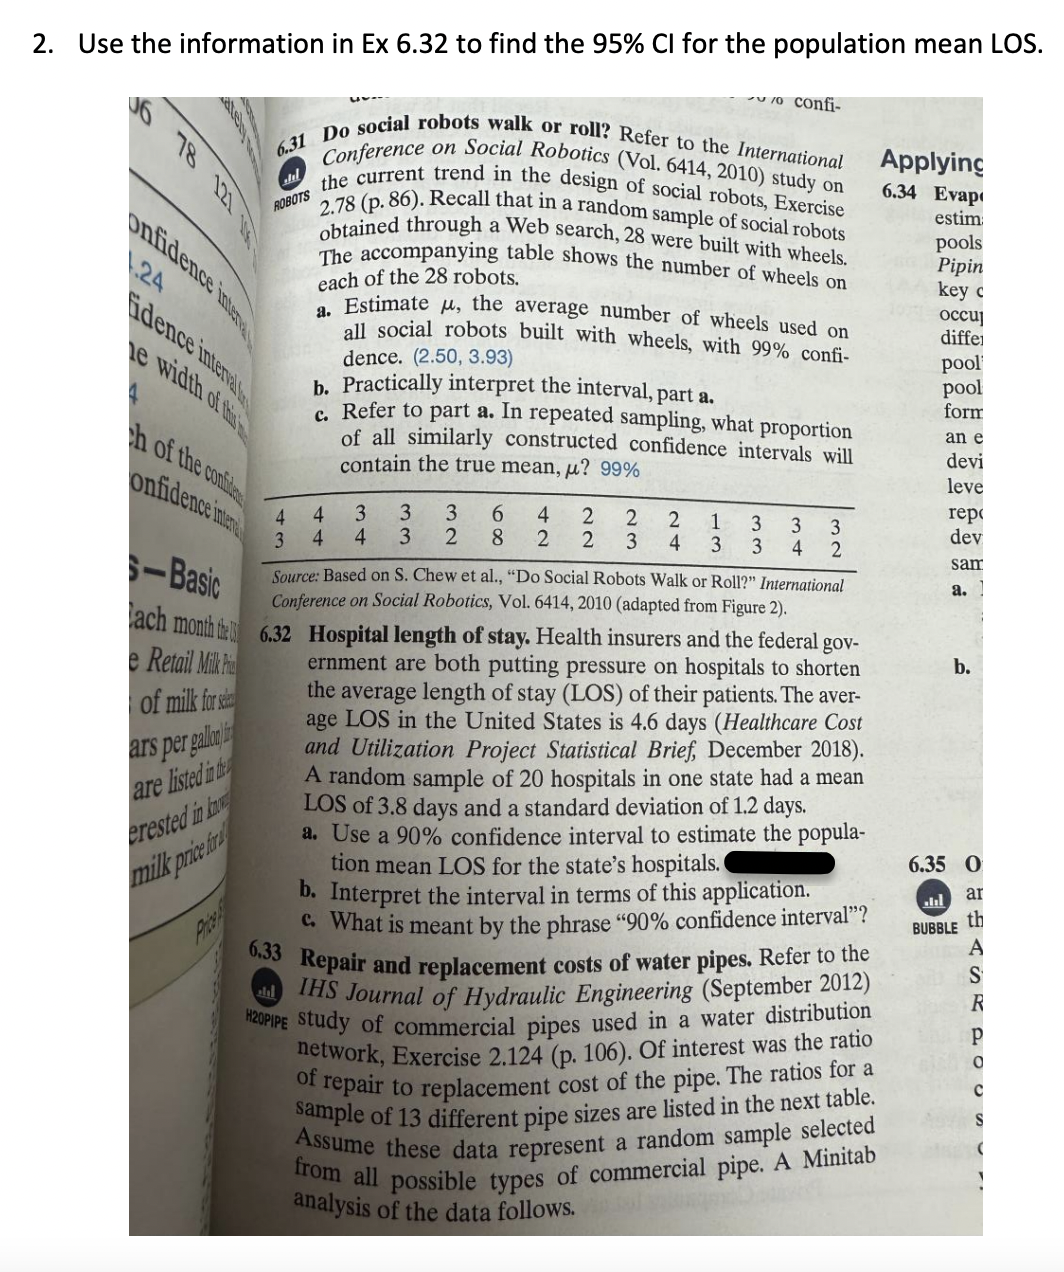
Transcribed Image Text:2. Use the information in Ex 6.32 to find the 95% CI for the population mean LOS.
78 121
6.31 Do social robots walk or roll? Refer to the International
on Social Robotics (Vol. 6414, 2010) study on
Conference
the current trend in the design of social robots, Exercise
2.78 (p. 86). Recall that in a random sample of social robots
obtained through a Web search, 28 were built with wheels.
The accompanying table shows the number of wheels on
each of the 28 robots.
ROBOTS
24
Fidence interval
he width of this
4
th of the confidenc
onfidence interne
ars per gallon
are listed in th
erested in k
milk price for
4
3
اباد
10 confi-
a.
Estimate , the average number of wheels used on
all social robots built with wheels, with 99% confi-
dence. (2.50, 3.93)
b. Practically interpret the interval, part a.
c. Refer to part a. In repeated sampling, what proportion
of all similarly constructed confidence intervals will
contain the true mean, u? 99%
3 3 6 4 2 2 2 1
2 8 2 2 3 4 3
4 3
4 4 3
3 3
3
3
4 2
-Basic
Source: Based on S. Chew et al., "Do Social Robots Walk or Roll?" International
Conference on Social Robotics, Vol. 6414, 2010 (adapted from Figure 2).
ach month the 6.32 Hospital length of stay. Health insurers and the federal gov-
e Retail Milk P
of milk for s
ernment are both putting pressure on hospitals to shorten
the average length of stay (LOS) of their patients. The aver-
age LOS in the United States is 4.6 days (Healthcare Cost
and Utilization Project Statistical Brief, December 2018).
A random sample of 20 hospitals in one state had a mean
LOS of 3.8 days and a standard deviation of 1.2 days.
a. Use a 90% confidence interval to estimate the popula-
tion mean LOS for the state's hospitals.
b. Interpret the interval in terms of this application.
c. What is meant by the phrase "90% confidence interval"?
6.33 Repair and replacement costs of water pipes. Refer to the
IHS Journal of Hydraulic Engineering (September 2012)
H20PIPE Study of commercial pipes used in a water distribution
network, Exercise 2.124 (p. 106). Of interest was the ratio
of repair to replacement cost of the pipe. The ratios for a
sample of 13 different pipe sizes are listed in the next table.
Assume these data represent a random sample selected
from all possible types of commercial pipe. A Minitab
analysis of the data follows.
Applying
6.34 Evap
estim
pools
Pipin
key c
occuj
differ
pool
pool
form
an e
devi
leve
rep
dev
sam
a.
b.
6.35 O
ar
th
BUBBLE
A
S
R
P
Expert Solution
This question has been solved!
Explore an expertly crafted, step-by-step solution for a thorough understanding of key concepts.

This is a popular solution!

Trending now
This is a popular solution!

Step by step
Solved in 2 steps with 1 images

Recommended textbooks for you
MATLAB: An Introduction with Applications
Statistics
ISBN:
9781119256830
Author:
Amos Gilat
Publisher:
John Wiley & Sons Inc

Probability and Statistics for Engineering and th…
Statistics
ISBN:
9781305251809
Author:
Jay L. Devore
Publisher:
Cengage Learning

Statistics for The Behavioral Sciences (MindTap C…
Statistics
ISBN:
9781305504912
Author:
Frederick J Gravetter, Larry B. Wallnau
Publisher:
Cengage Learning
MATLAB: An Introduction with Applications
Statistics
ISBN:
9781119256830
Author:
Amos Gilat
Publisher:
John Wiley & Sons Inc
Probability and Statistics for Engineering and th…
Statistics
ISBN:
9781305251809
Author:
Jay L. Devore
Publisher:
Cengage Learning
Statistics for The Behavioral Sciences (MindTap C…
Statistics
ISBN:
9781305504912
Author:
Frederick J Gravetter, Larry B. Wallnau
Publisher:
Cengage Learning

Elementary Statistics: Picturing the World (7th E…
Statistics
ISBN:
9780134683416
Author:
Ron Larson, Betsy Farber
Publisher:
PEARSON

The Basic Practice of Statistics
Statistics
ISBN:
9781319042578
Author:
David S. Moore, William I. Notz, Michael A. Fligner
Publisher:
W. H. Freeman

Introduction to the Practice of Statistics
Statistics
ISBN:
9781319013387
Author:
David S. Moore, George P. McCabe, Bruce A. Craig
Publisher:
W. H. Freeman