Monthly Income Monthly Expenses ITEM AMOUNT ITEM Column1 AMOUNT Income Source 1 $2,000.00 Rent $800.00 Cell phone $100.00 Groceries $200.00 Car payment $273.00 Auto expenses $120.00 Student loans $250.00 Credit cards $100.00 Auto Insurance $78.00 Personal care $50.00 Entertainment $100.000 Miscellaneous $50.00
Q: Weekly Sales (dollara) Space (sq. ft.) 6,060 5,230 4, 280 5,580 5,670 5,020 5,410 4,990 4,220 4,160…
A: Scatter plot : Scatter plot is used to examine the linear relation ship between two variables. where…
Q: Franchise and Business Opportunities Annual Report contains information about franchise…
A: Given information: 21, 25, 25, 18, 44, 20, 25, 15, 19, 24, 28, 30, 25, 25, 25, 25, 10, 25, 35, 20,…
Q: 1. Grade Point Averages The average undergraduate grade point average (GPA) for the 25 top-ranked…
A: Given data is…
Q: TITLE: Comparison of the weekly allowance of male and female students Research Question: 1. How does…
A: null hypothesis : there is no significance difference between male and female students of weekly…
Q: 00 %24 Contribution Margin and Contribution Margin Ratio For a recent year, Wicker Company-owned…
A: Given that, Total sales (Revenue) = $ 41000 million Expenses are following, Food and packaging = $…
Q: July Price Percent of Increase or Decrease Item April Price 1. Sack of rice 2. Can of sardines 3.…
A: Given incomplete chart is Item April price July Price % of increase(+) or decrease(-) 1. Sack…
Q: Weekly Income 1553 Food Budget Food Budget Weekly Income 1636 1598 1639 1680 1740 1655 1677 1660…
A:
Q: Engineering - Average Annual Salaries & Hourly Wages for Undergraduates by Program, Summer…
A: Tabular presentation of data is more convincing and they are not interesting because of numerical…
Q: :Presentation of data include Mathematical presentation Tabular presentation. Graphical…
A: Let us solve the given data based problem in the next step.
Q: One of the many wonderful things about studying statistics is that graduate programs in statistics…
A:
Q: Product market monetary flow physical flow taxes government purchases Households expenditures…
A:
Q: Items of Expenditure diagram: Food Family A (Income 500) Family B (Income 300 150 150 Clothing…
A: Given: The data table given is as shown below Family A Family B Food 150 150 Clothing 125…
Q: Class Frequency Cumulative Relative Percentage Cumulative Frequency Frequency Percentage 0-1000 22…
A:
Q: File Home Insert Page Layout Formulas Data Review View Help J2 fe A B D H. K M 3 4 Consider the…
A: Following data is given Y x1 x2 x3 x4 78.5 7 26 6 60 74.3 1 29 15 52 104.3 11 56 8 20…
Q: %Year Population 1900 3437202 1910 4766883 1920 5620048 1930 6930446 1940 7454995 1950 7891957 1960…
A: Sorry to say that according to our guidelines we can answer the first three sub parts. Please post…
Q: Year Quarter Revenue 2005 Qtr1 5,206 In row-column format…
A:
Q: • department-the department letter code (letters A through F) • gender-the gender of the student…
A: Solution
Q: Part 1 A bank developed a model for predicting the average checking and savings account balance as…
A: Solution: The estimated multiple regression equation is Bank Balance^= -17091+386×Age+1466×years…
Q: Population A Population B Age Total Population Deaths Total Population Deaths 0-29 154 5 350 10…
A: Introduction - Age-standardized (ASDR) =deaths in age group estimated population of that age group…
Q: The U.S. Census Bureau needs to estimate the median income of females in the U.S., they collect…
A: To estimate the median income of the females in U.S, income from 3500 females is collected.
Q: Year Enrolment Year 2011 1,200 2015 2012 1,500 2016 2013 2,000 2017 2014 2,500 2018 Forecast the…
A: In this question, the concept of average is applied. Average The arithmetic mean is the ratio of the…
Q: Describe the three major categories of data (time-series, cross-sectional, and panel)
A: Time series data Time series data of a variable have a set of observations on values at different…
Q: tistics question is belo
A: The following null and alternative hypotheses need to be tested: This corresponds to a left-tailed…
Q: Data showing the population by state as of 2012 in millions of people follow (The World Almanac). No…
A: Frequency is the measure of count. It measure the larger set of data set into discrete or continuous…
Q: Side Panel Expand side panel Breadcrumb: Discussions List View Topic Settings Help…
A: Use EXCEL Procedure to obtain the values of mean, median, mode, range and standard deviation for…
Q: Area A Area B Area C Area D 1275 1124 1085 928 1110 954 827 1096 975 815 793 862 862 1078 1170 735…
A: Area A B C D 1275 1124 1085 928 1110 954 827 1096 975 815 793 862 862 1078 1170 735 1040…
Q: LibraryThe weights in milligram of 1500 seeds of the long pine is represented by the following…
A:
Q: High Cholesterol: A group of eight individuals with high cholesterol levels were given a new drug…
A:
Q: The U.S. Department of Health & Human Services (HHS) is a department of the U.S. federal government…
A: Given: The U.S department includes the Health & Human Services (HHS) based on the U.S. federal…
Q: categories. Complete parts (A) through (D) below. Females at Minimum Wage Females below Minimum Wage…
A: It is given that the number of male and female workers earning at or below the minimum wage for…
Q: What research collects numeric Experimental data ما هي الأبحاث التي تجمع بيانات رقمية a.…
A: The research can be of different types based on the field of study and the work. The research is…
Q: What is the problem all about? How are you going to interpret the given data? How are you going to…
A: We are going tell you about the interpretation of information of height & calculation about it.…
Q: Identify the type of data: Height of students in a class. Continuous Numerical Data…
A: According to the given information in this question We need to identify the type of data
Q: Federal Minimum Wage (for Years in Which a Change Occurred) Year Actual dollars 1996 dollars 1938…
A: From the given data in the question the table value predicts thatThere has…
Q: Age 1000 6. 1. 991 6. 985 3. 982 3. 4. 979 3. 976 4 6. 972 4. 7. 968 4 8. 964 4. 959 Find (i) I;…
A: Life table is a table that represents the life history of a hypothetical group as it is gradually…
Q: demand for Soft Shag carpet mill, customers
A: Adjusted Exponential Smoothing used for making forecasts consists of using an exponential smoothing…
Q: Drivers’ licenses 2011 The following table shows thenumber of licensed U.S. drivers by age and by…
A: Hey there! Thank you for posting the question. Since your question has more than 3 parts, we are…
Q: Age (Years) Less than high school High school graduate Some college College Degree graduate 15 to 17…
A:
Q: Profit Total cost Total Revenue Fixed cost Total Production Revenue Variable Volume per Unit Cost…
A: Influence diagram: An influence diagram is a graphical device showing the relationships among the…
Q: Engineering - Average Annual Salaries & Hourly Wages for Undergraduates by Program, Summer…
A: Diagrammatic representation is one of the easiest way to interpret the data. A bar chart is one of…
Q: Sex of the U.S. workforce 100,000 Women Men 80,000 60,000 40,000 20,000 1970 1980 1990 2000 2010…
A:
Q: Quality Control Value of Glucose for the Month of January, 2020. Day Level 1 Level 2 Day 11 Level 1…
A: To Calculate mean we use, =Mean(number 1, number 2 ...........) To calculate mode, =Mode(number 1,…
Q: Amazon Revenue The annual revenue of Amazon is given in the table below (source ). Amazon Annual…
A: The following information has been given: Year (x) Amazon Annual Revenue(Y) 2020 386.064 2019…
Q: Office Space Size and Yearly Rent 160,000 120,000 80,000 40,000 500 1,000 1,500 2,000 2,500 3,000…
A:
Q: • Stem-and-Leaf Plot -o Boxplot O Histogram O Pie Chart O Bar Chart Dotplot a. quantitative b.…
A: Ans . 1. A stem-and-leaf plot is a graph of quantitative data that is similar to a histogram in…
Q: Population by broad age groups in country A, 1990 & 2011 Country A 2011 Country A 1990 Both Age…
A: Hello thank you for the question, According to our honor code can answer only three sub parts at a…
This is Ben’s budget. Use his budget to determine the answer to the following question:
Calculate Ben’s net take-home pay.
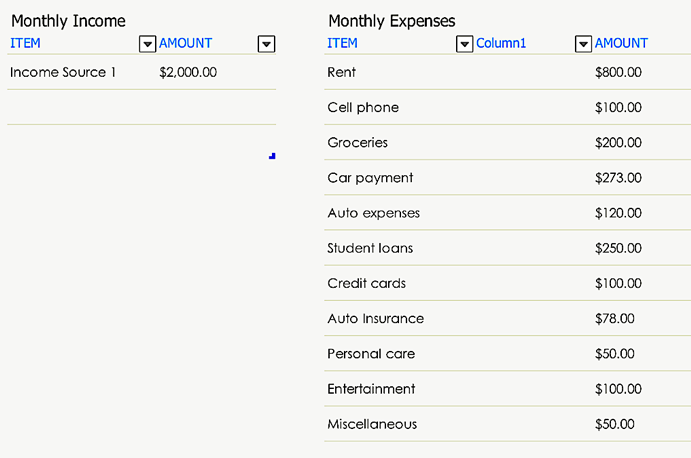
Trending now
This is a popular solution!
Step by step
Solved in 2 steps with 2 images
- Student Debt, Recent Graduates UNC System Schools Name Institution Sector Average debt of graduates Appalachian State University Public, 4-year or above $22,855 East Carolina University Public, 4-year or above $28,918 North Carolina A & T State University Public, 4-year or above $34,379 North Carolina State University Public, 4-year or above $24,053 University of North Carolina School of the Arts Public, 4-year or above $28,551 University of North Carolina Wilmington Public, 4-year or above $24,605 University of North Carolina at Asheville Public, 4-year or above $23,824 University of North Carolina at Chapel Hill Public, 4-year or above $22,214 University of North Carolina at Charlotte Public, 4-year or above $27,453 University of North Carolina at Greensboro Public, 4-year or above $26,841 University of North Carolina at Pembroke Public, 4-year or above $25,831 Western Carolina University Public, 4-year or above $15,669 1) what is the…ID Gender Age Class Major Grad Intention GPA Employment Salary Social Networking Satisfaction Spending Computer Text Messages Wealth 1 Female 20 Junior Other Yes 2.9 Full-Time 50.0 1 3 350 Laptop 200 2.00 2 Male 23 Senior Management Yes 3.9 Part-Time 25.0 1 4 360 Laptop 50 10.00 3 Male 21 Junior Other Yes 2.5 Part-Time 45.0 2 4 600 Laptop 200 70.00 4 Male 21 Junior CIS Yes 2.5 Full-Time 40.0 4 6 600 Laptop 250 100.00 5 Male 23 Senior Other Undecided 2.8 Unemployed 40.0 2 4 500 Laptop 100 1.00 6 Female 22 Senior Economics/Finance Undecided 2.3 Unemployed 90.0 3 2 700 Laptop 30 5.00 7 Female 21 Junior Other Undecided 3.0 Part-Time 50.0 1 3 500 Laptop 50 0.60 8 Female 22 Senior Other Undecided 3.1 Full-Time 80.0 1 2 200 Tablet 300 1.00 9 Female 20 Junior Management Yes 3.9 Unemployed 30.0 0 4 500 Laptop 400 0.60 10 Female 21 Senior Economics/Finance Undecided 3.3 Part-Time 37.5 1 4 200 Laptop 100 1.00 11 Female 23 Senior Economics/Finance Yes 2.8 Full-Time 50.0 2 5…Expenses MSA Expenses Regular Health MSA Health Regular 413.92 597.83 2 2 150.55 353.84 1 1 287.26 540.03 1 1 609.82 551.42 2 2 358.9 620.41 2 1 317.87 507.36 1 1 415.75 507.05 2 1 256.73 673.14 2 1 429.24 525.77 1 1 0 333.1 2 2 429.23 383.78 1 1 598.42 616.68 1 1 424.7 460.88 1 1 293.94 223.27 1 1 25.5 559.87 1 1 481.93 579.1 1 1 347.73 447.95 1 1 235.12 476.57 1 1 353.91 408.15 1 2 197.22 397.14 1 1 125.61 415.49 1 1 376.86 517.23 1 2 337.36 404.87 1 1 481.22 639.35 1 1 367.8 454.03 1 2 164.3 289.86 2 1 330.54 546.59 1 1 338.36 361.42 1 1 187.62 518.18 2 2 292.97 561.44 1 1 384.85 482.4 1 1 286.55 361.51 1 1 566.91 658.18 2 2 225.1 590.34 2 1 148.96 584.15 1 1 373.36 665.71 1 1 168.28 468.04 1 1 281.64 247.68 1 1 555.2 331.35 1 1 354.1 391.79 1 1 409.97 433.39 1 1 605.43 403.15 1 1 440.25 416.28 2 1 513.88 645.89 1 1 348.7 820.4 1 2 431.81 682.14 1 1 205.47 254.64 1 1 304.87 627.84 1 1…
- School Type Cost 30 Year ROI Annual ROI Private $222,700.00 $1,786,000.00 7.70% Private $176,400.00 $1,758,000.00 8.40% Private $212,200.00 $1,714,000.00 7.80% Public $125,100.00 $1,535,000.00 9.10% Private $212,700.00 $1,529,000.00 7.40% Public $92,910.00 $1,501,000.00 10.10% Private $214,900.00 $1,485,000.00 7.30% Private $217,800.00 $1,483,000.00 7.20% Private $225,600.00 $1,444,000.00 7.00% Private $217,300.00 $1,442,000.00 7.10% Private $226,500.00 $1,441,000.00 7.00% Private $215,500.00 $1,438,000.00 7.20% Private $223,500.00 $1,428,000.00 7.00% Private $226,600.00 $1,414,000.00 7.00% Private $189,300.00 $1,397,000.00 7.50% Public $89,700.00 $1,382,000.00 9.90% Public $87,030.00 $1,376,000.00 10.00% Private $218,200.00 $1,343,000.00 6.90% Private $229,900.00 $1,339,000.00 6.70% Private $148,800.00 $1,321,000.00 8.10% Calculate the estimated ‘Annual % ROI’ when the ‘Cost’ (X) is $160,000. Test the hypothesis: o H0: β1 = 0 o Ha: β1…Customer Type of Customer Items Net Sales Method of Payment Gender Marital Status Age 1 Regular 1 39.50 Discover Male Married 32 2 Promotional 1 102.40 Proprietary Card Female Married 36 3 Regular 1 22.50 Proprietary Card Female Married 32 4 Promotional 5 100.40 Proprietary Card Female Married 28 5 Regular 2 54.00 MasterCard Female Married 34 6 Regular 1 44.50 MasterCard Female Married 44 7 Promotional 2 78.00 Proprietary Card Female Married 30 8 Regular 1 22.50 Visa Female Married 40 9 Promotional 2 56.52 Proprietary Card Female Married 46 10 Regular 1 44.50 Proprietary Card Female Married 36 11 Regular 1 29.50 Proprietary Card Female Married 48 12 Promotional 1 31.60 Proprietary Card Female Married 40 13 Promotional 9 160.40 Visa Female Married 40 14 Promotional 2 64.50 Visa Female Married 46 15 Regular 1 49.50 Visa Male Single 24 16 Promotional 2 71.40 Proprietary Card Male Single 36 17 Promotional 3 94.00 Proprietary Card Female Single 22 18…School Pay Other Pay Total Pay Max Bonus Athletic Department Total Revenue 866250 26500 892750 247500 39031348 406000 #N/A 406000 255000 27954164 6950203 209984 7160187 700000 143776550 500000 #N/A 500000 430000 28159249 225000 #N/A 225000 25000 19775727 2898500 400000 3298500 2125000 68510915 2700000 2960 2702960 3491000 65673955 3200000 14000 3214000 700000 99770840 700000 #N/A 700000 235000 16281038 834667 #N/A 834667 256000 37289204 3850000 4500 3854500 1400000 103680609 500000 3500 503500 450000 21315999 1000004 #N/A 1000004 400000 43166257 405000 0 405000 130000 23611448 380210 0 380210 470000 28964050 1800000 8000 1808000 304000 94487380 1800000 0 1800000 750000 41222301 360000 0 360000 305000 27680624 2200000 0 2200000 565000 61915431 3150000 25100 3175100 1200000 69061398 2008500 1650 2010150 1500000 58334345 1500000 #N/A 1500000 150000 34791926 1500000 #N/A 1500000 450000 63336022 1250000 2500 1252500 550000 35805232 425000…
- Kelson Sporting Equipment, Inc., makes two different types of baseball gloves: a regular model and a catcher’s model. The firm has 900 hours of production time available in its cutting and sewing department, 300 hours available in its finishing department, and 100 hours available in its packaging and shipping department. The production time requirements and the profit contribution per glove are given in the following table Production Time Model Cutting and Sewing Finishing Packaging and Shipping Profit / Glove Regular Model 1 1/2 1/8 $5 Catcher Model 3/2 1/3 1/4 $8 Assuming that the company is interested in maximizing the total profit contribution, answer the following: What is the linear programming model for this problem? Find the optimal solution using the graphical solution procedure. How many gloves of each model should Kelson Manufacture? What is the total profit contribution Kelson can earn with…Annual Food Spending ($) Annual Household Income ($) Non mortgage household debt ($) Region: 1 = NE 2 = MW 3 = S 4 = W Location: 1 = Metro 2 = Outside Metro 8909 56697 23180 1 1 5684 35945 7052 1 1 10706 52687 16149 1 1 14112 74041 21839 1 1 13855 63182 18866 1 1 15619 79064 21899 1 1 2694 25981 8774 1 1 9127 57424 15766 1 1 13514 72045 27685 1 1 6314 38046 8545 1 1 7622 52408 28057 1 1 4322 41405 6998 1 1 3805 29684 4806 1 1 6674 49246 13592 1 1 7347 41491 4088 1 1 2911 26703 15876 1 1 8026 48753 16714 1 1 8567 55555 16783 1 1 10345 71483 21407 1 1 8694 50980 19114 1 1 8821 46403 7817 1 1 8678 51927 14415 1 1 14331 84769 17295 1 1 9619 59062 16687 1 1 9286 57952 14161 1 1 8206 58355 19538 1 1 16408 81694 15187 1 1 12757 69522 14651 1 1 17740 96132 0 1 1 7739 57796 22057 1 1 15383 88276 1896 1 1 4579 32264 7979 1 1 11679 65928 0 1 1 12877 69924 27330 1 1 16232 91108 9876 1 1 9621…Annual Food Spending ($) Annual Household Income ($) Non mortgage household debt ($) Region: 1 = NE 2 = MW 3 = S 4 = W Location: 1 = Metro 2 = Outside Metro 8909 56697 23180 1 1 5684 35945 7052 1 1 10706 52687 16149 1 1 14112 74041 21839 1 1 13855 63182 18866 1 1 15619 79064 21899 1 1 2694 25981 8774 1 1 9127 57424 15766 1 1 13514 72045 27685 1 1 6314 38046 8545 1 1 7622 52408 28057 1 1 4322 41405 6998 1 1 3805 29684 4806 1 1 6674 49246 13592 1 1 7347 41491 4088 1 1 2911 26703 15876 1 1 8026 48753 16714 1 1 8567 55555 16783 1 1 10345 71483 21407 1 1 8694 50980 19114 1 1 8821 46403 7817 1 1 8678 51927 14415 1 1 14331 84769 17295 1 1 9619 59062 16687 1 1 9286 57952 14161 1 1 8206 58355 19538 1 1 16408 81694 15187 1 1 12757 69522 14651 1 1 17740 96132 0 1 1 7739 57796 22057 1 1 15383 88276 1896 1 1 4579 32264 7979 1 1 11679 65928 0 1 1 12877 69924 27330 1 1 16232 91108 9876 1 1 9621 54070 19908 1 1 8171 47238 17819…