Area A Area B Area C Area D 1275 1124 1085 928 1110 954 827 1096 975 815 793 862 862 1078 1170 735 1040 843 919 798 997 745 943 812 1119 796 756 1232 908 816 765 1036 890 938 809 998 1055 1082 1020 914 860 750 710 1005 975 703 775 930
Area A Area B Area C Area D 1275 1124 1085 928 1110 954 827 1096 975 815 793 862 862 1078 1170 735 1040 843 919 798 997 745 943 812 1119 796 756 1232 908 816 765 1036 890 938 809 998 1055 1082 1020 914 860 750 710 1005 975 703 775 930

Algebra & Trigonometry with Analytic Geometry
13th Edition
ISBN:9781133382119
Author:Swokowski
Publisher:Swokowski
Chapter7: Analytic Trigonometry
Section7.2: Trigonometric Equations
Problem 97E

Related questions
Question
100%
(a) How to construct frequency histograms, frequency
histograms, and ogives?
(b) What type of graph would you choose to display the data? Explain your reasoning.
(c) Construct the graph from part (b).
Transcribed Image Text:1 Introduction
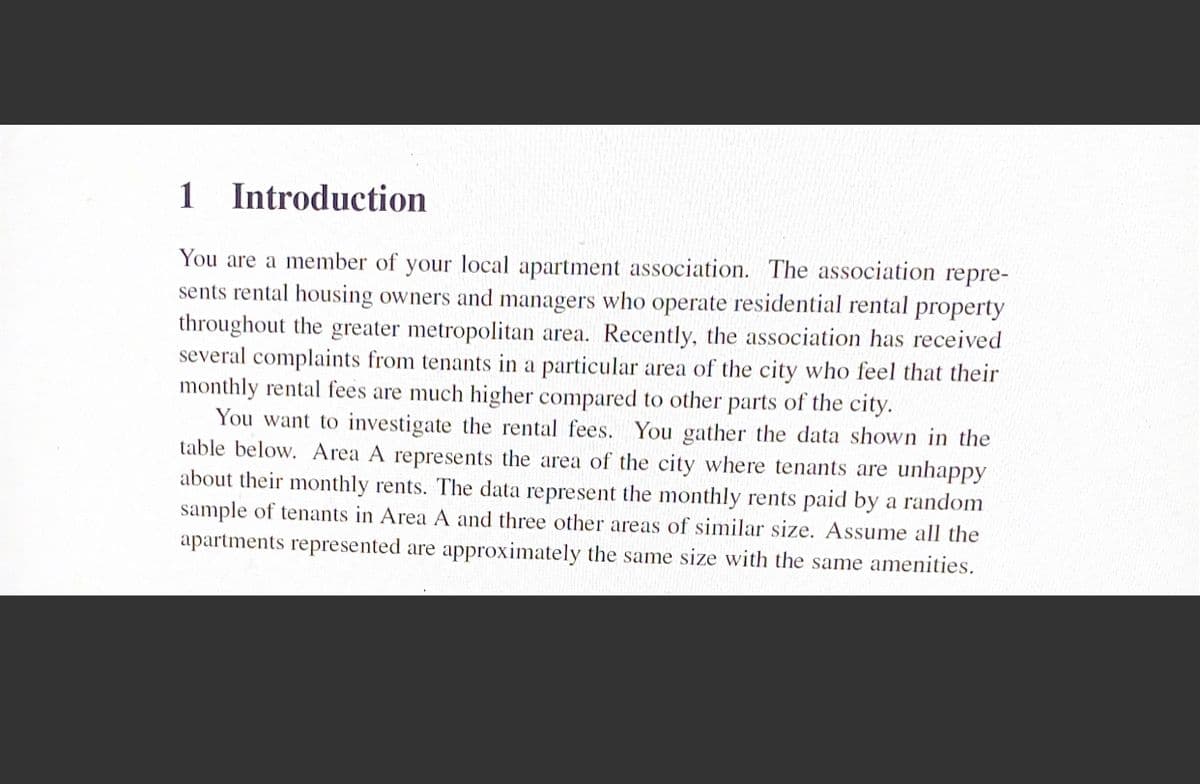
You are a member of your local apartment association. The association repre-
sents rental housing owners and managers who operate residential rental property
throughout the greater metropolitan area. Recently, the association has received
several complaints from tenants in a particular area of the city who feel that their
monthly rental fees are much higher compared to other parts of the city.
You want to investigate the rental fees. You gather the data shown in the
table below. Area A represents the area of the city where tenants are unhappy
about their monthly rents. The data represent the monthly rents paid by a random
sample of tenants in Area A and three other areas of similar size. Assume all the
apartments represented are approximately the same size with the same amenities.
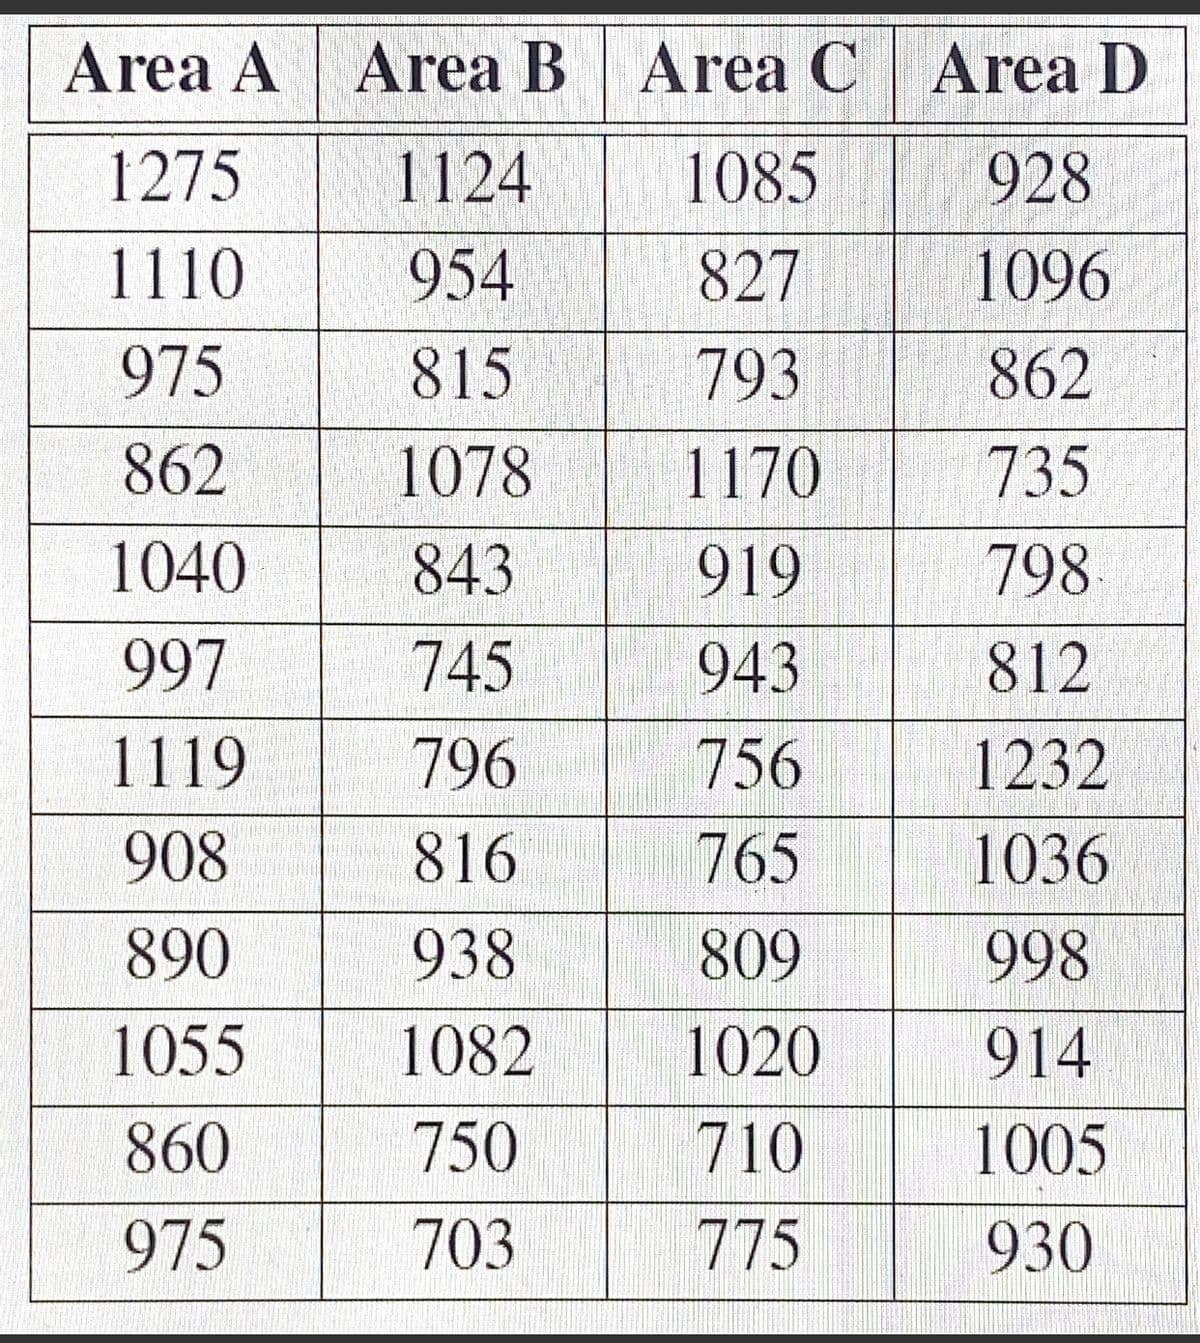
Transcribed Image Text:Area A Area B Area C Area D
1275
1124
1085
928
1110
954
827
1096
975
815
793
862
862
1078
1170
735
1040
843
919
798
997
745
943
812
1119
796
756
1232
908
816
765
1036
890
938
809
998
1055
1082
1020
914
860
750
710
1005
975
703
775
930
Expert Solution
This question has been solved!
Explore an expertly crafted, step-by-step solution for a thorough understanding of key concepts.

This is a popular solution!

Trending now
This is a popular solution!

Step by step
Solved in 3 steps with 4 images

Recommended textbooks for you
Algebra & Trigonometry with Analytic Geometry
Algebra
ISBN:
9781133382119
Author:
Swokowski
Publisher:
Cengage

Trigonometry (MindTap Course List)
Trigonometry
ISBN:
9781337278461
Author:
Ron Larson
Publisher:
Cengage Learning

Linear Algebra: A Modern Introduction
Algebra
ISBN:
9781285463247
Author:
David Poole
Publisher:
Cengage Learning
Algebra & Trigonometry with Analytic Geometry
Algebra
ISBN:
9781133382119
Author:
Swokowski
Publisher:
Cengage
Trigonometry (MindTap Course List)
Trigonometry
ISBN:
9781337278461
Author:
Ron Larson
Publisher:
Cengage Learning
Linear Algebra: A Modern Introduction
Algebra
ISBN:
9781285463247
Author:
David Poole
Publisher:
Cengage Learning