Mr. Miller gave a 5-point quiz to a small class of two students. The students' names and quiz scores are given below. Name Score Hong 4 Laura Consider these two students to be a population. (The population mean of their scores is µ=4.50 and the population standard deviation of their scores is o = 0.50.)
Mr. Miller gave a 5-point quiz to a small class of two students. The students' names and quiz scores are given below. Name Score Hong 4 Laura Consider these two students to be a population. (The population mean of their scores is µ=4.50 and the population standard deviation of their scores is o = 0.50.)

Glencoe Algebra 1, Student Edition, 9780079039897, 0079039898, 2018
18th Edition
ISBN:9780079039897
Author:Carter
Publisher:Carter
Chapter10: Statistics
Section10.5: Comparing Sets Of Data
Problem 14PPS

Related questions
Question
Hello! Please click on both images to view the question in full.
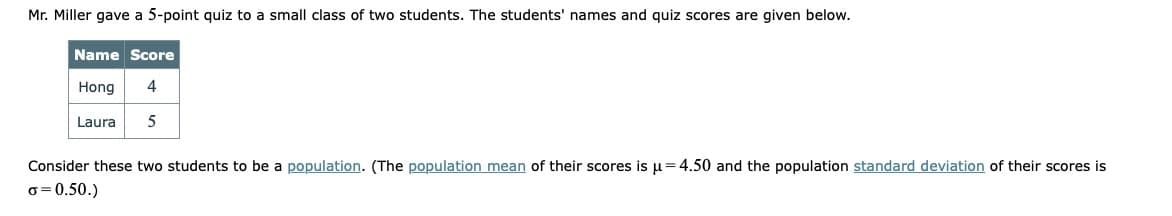
Transcribed Image Text:Mr. Miller gave a 5-point quiz to a small class of two students. The students' names and quiz scores are given below.
Name Score
Hong
4
Laura
Consider these two students to be a population. (The population mean of their scores is µ=4.50 and the population standard deviation of their scores is
o = 0.50.)
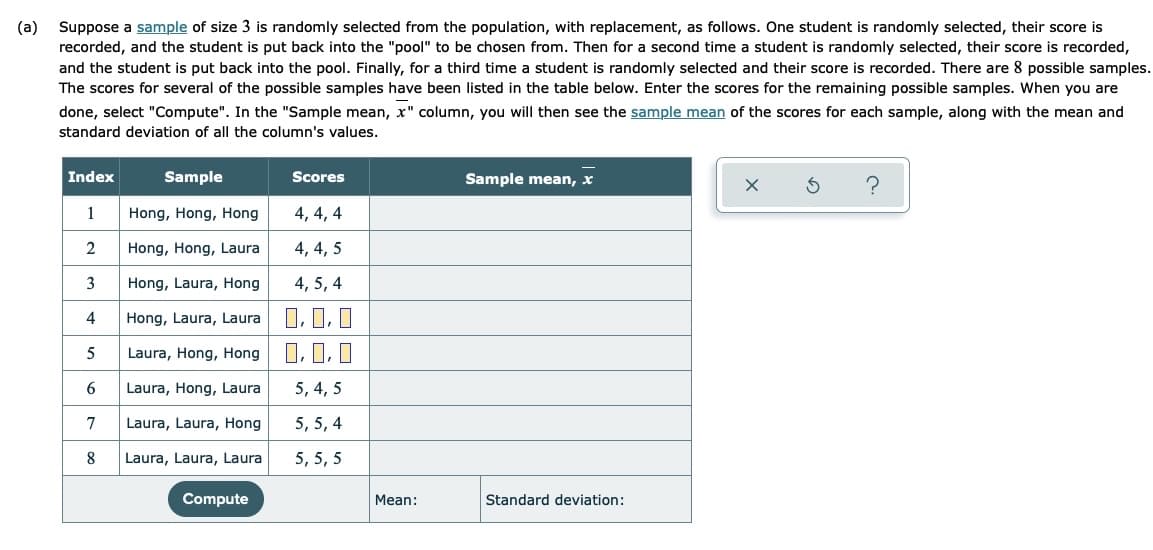
Transcribed Image Text:Suppose a sample of size 3 is randomly selected from the population, with replacement, as follows. One student is randomly selected, their score is
recorded, and the student is put back into the "pool" to be chosen from. Then for a second time a student is randomly selected, their score is recorded,
and the student is put back into the pool. Finally, for a third time a student is randomly selected and their score is recorded. There are 8 possible samples.
The scores for several of the possible samples have been listed in the table below. Enter the scores for the remaining possible samples. When you are
(a)
done, select "Compute". In the "Sample mean, x" column, you will then see the sample mean of the scores for each sample, along with the mean and
standard deviation of all the column's values.
Index
Sample
Scores
Sample mean, x
1
Hong, Hong, Hong
4, 4, 4
2
Hong, Hong, Laura
4, 4, 5
3
Hong, Laura, Hong
4, 5, 4
I, 1, I
O, 0, 0
4
Hong, Laura, Laura
5
Laura, Hong, Hong
6.
Laura, Hong, Laura
5, 4, 5
7
Laura, Laura, Hong
5, 5, 4
8
Laura, Laura, Laura
5, 5, 5
Compute
Mean:
Standard deviation:
Expert Solution
This question has been solved!
Explore an expertly crafted, step-by-step solution for a thorough understanding of key concepts.

This is a popular solution!

Trending now
This is a popular solution!

Step by step
Solved in 2 steps with 2 images

Recommended textbooks for you
Glencoe Algebra 1, Student Edition, 9780079039897…
Algebra
ISBN:
9780079039897
Author:
Carter
Publisher:
McGraw Hill
Glencoe Algebra 1, Student Edition, 9780079039897…
Algebra
ISBN:
9780079039897
Author:
Carter
Publisher:
McGraw Hill