Is there any relationship between the satisfaction of Hong Kong, the attractiveness of Hong Kong and the likelihood of a return to Hong Kong?
Is there any relationship between the satisfaction of Hong Kong, the attractiveness of Hong Kong and the likelihood of a return to Hong Kong?

MATLAB: An Introduction with Applications
6th Edition
ISBN:9781119256830
Author:Amos Gilat
Publisher:Amos Gilat
Chapter1: Starting With Matlab
Section: Chapter Questions
Problem 1P

Related questions
Question
Is there any relationship between the satisfaction of Hong Kong, the attractiveness of Hong Kong and the likelihood of a return to Hong Kong?
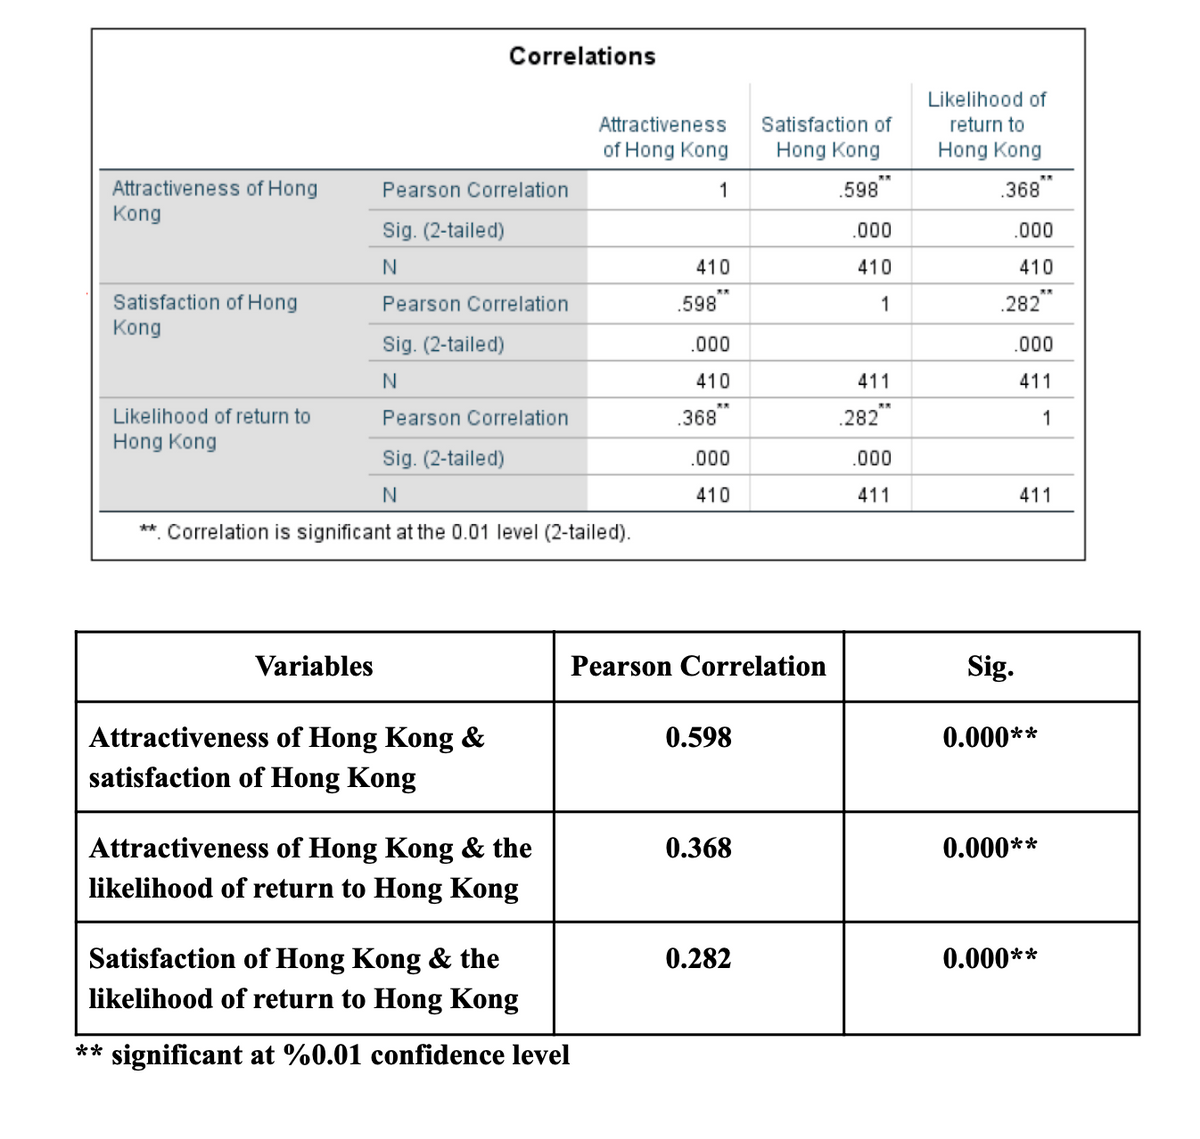
Transcribed Image Text:Correlations
Likelihood of
Attractiveness
Satisfaction of
return to
of Hong Kong
Hong Kong
Hong Kong
Attractiveness of Hong
Kong
Pearson Correlation
1
.598
.368
Sig. (2-tailed)
.000
.000
410
410
410
.282"
Satisfaction of Hong
Kong
Pearson Correlation
.598
1
Sig. (2-tailed)
.000
.000
410
411
411
Likelihood of return to
Pearson Correlation
.368
.282"
1
Hong Kong
Sig. (2-tailed)
.000
.000
410
411
411
**. Correlation is significant at the 0.01 level (2-tailed).
Variables
Pearson Correlation
Sig.
Attractiveness of Hong Kong &
satisfaction of Hong Kong
0.598
0.000**
Attractiveness of Hong Kong & the
likelihood of return to Hong Kong
0.368
0.000**
Satisfaction of Hong Kong & the
0.282
0.000**
likelihood of return to Hong Kong
significant at %0.01 confidence level
**
Expert Solution
This question has been solved!
Explore an expertly crafted, step-by-step solution for a thorough understanding of key concepts.

Step by step
Solved in 2 steps

Recommended textbooks for you
MATLAB: An Introduction with Applications
Statistics
ISBN:
9781119256830
Author:
Amos Gilat
Publisher:
John Wiley & Sons Inc

Probability and Statistics for Engineering and th…
Statistics
ISBN:
9781305251809
Author:
Jay L. Devore
Publisher:
Cengage Learning

Statistics for The Behavioral Sciences (MindTap C…
Statistics
ISBN:
9781305504912
Author:
Frederick J Gravetter, Larry B. Wallnau
Publisher:
Cengage Learning
MATLAB: An Introduction with Applications
Statistics
ISBN:
9781119256830
Author:
Amos Gilat
Publisher:
John Wiley & Sons Inc
Probability and Statistics for Engineering and th…
Statistics
ISBN:
9781305251809
Author:
Jay L. Devore
Publisher:
Cengage Learning
Statistics for The Behavioral Sciences (MindTap C…
Statistics
ISBN:
9781305504912
Author:
Frederick J Gravetter, Larry B. Wallnau
Publisher:
Cengage Learning

Elementary Statistics: Picturing the World (7th E…
Statistics
ISBN:
9780134683416
Author:
Ron Larson, Betsy Farber
Publisher:
PEARSON

The Basic Practice of Statistics
Statistics
ISBN:
9781319042578
Author:
David S. Moore, William I. Notz, Michael A. Fligner
Publisher:
W. H. Freeman

Introduction to the Practice of Statistics
Statistics
ISBN:
9781319013387
Author:
David S. Moore, George P. McCabe, Bruce A. Craig
Publisher:
W. H. Freeman