MSC S= MC 4. D=MSB Quantity (millions of tons per year) 1. The figure above shows the market for steel, the production of which creates pollution. a) What point represents the equilibrium price and what point represents the equilibrium quantity in an unregulated, competitive market? What area represents the deadweight loss of the unregulated, competitive market outcome? b) c) What point represents the efficient quantity? d) If the output level in part (c) was achieved through the use of a government imposed tax, what price would consumers pay? What price would the producers receive? What distance represents the amount of the tax? If government successfully uses marketable permits to eliminate the external cost, what point represents how much output would be produced? e) Price and cost (hundreds of dollars per ton) O...
MSC S= MC 4. D=MSB Quantity (millions of tons per year) 1. The figure above shows the market for steel, the production of which creates pollution. a) What point represents the equilibrium price and what point represents the equilibrium quantity in an unregulated, competitive market? What area represents the deadweight loss of the unregulated, competitive market outcome? b) c) What point represents the efficient quantity? d) If the output level in part (c) was achieved through the use of a government imposed tax, what price would consumers pay? What price would the producers receive? What distance represents the amount of the tax? If government successfully uses marketable permits to eliminate the external cost, what point represents how much output would be produced? e) Price and cost (hundreds of dollars per ton) O...

Managerial Economics: Applications, Strategies and Tactics (MindTap Course List)
14th Edition
ISBN:9781305506381
Author:James R. McGuigan, R. Charles Moyer, Frederick H.deB. Harris
Publisher:James R. McGuigan, R. Charles Moyer, Frederick H.deB. Harris
Chapter4: Estimating Demand
Section: Chapter Questions
Problem 7E

Related questions
Question
solve the following?
Transcribed Image Text:MSC
S = MC
b
4.
D=MSB
e
Quantity (millions of tons per year)
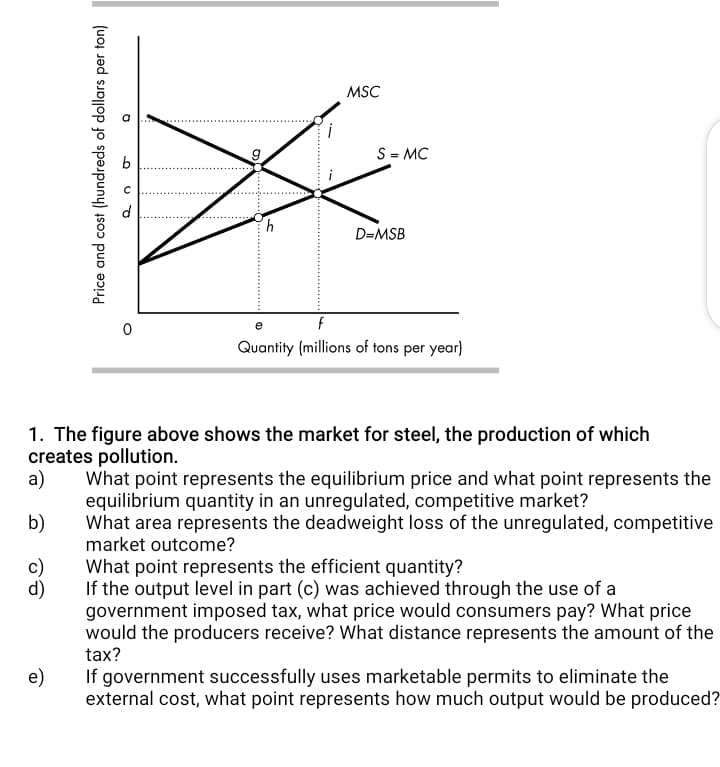
1. The figure above shows the market for steel, the production of which
creates pollution.
а)
What point represents the equilibrium price and what point represents the
equilibrium quantity in an unregulated, competitive market?
What area represents the deadweight loss of the unregulated, competitive
market outcome?
b)
c)
d)
What point represents the efficient quantity?
If the output level in part (c) was achieved through the use of a
government imposed tax, what price would consumers pay? What price
would the producers receive? What distance represents the amount of the
tax?
If government successfully uses marketable permits to eliminate the
external cost, what point represents how much output would be produced?
e)
Price and cost (hundreds of dollars per ton)
O......
Expert Solution
This question has been solved!
Explore an expertly crafted, step-by-step solution for a thorough understanding of key concepts.

This is a popular solution!

Trending now
This is a popular solution!

Step by step
Solved in 2 steps

Knowledge Booster


Learn more about
Need a deep-dive on the concept behind this application? Look no further. Learn more about this topic, economics and related others by exploring similar questions and additional content below.Recommended textbooks for you
Managerial Economics: Applications, Strategies an…
Economics
ISBN:
9781305506381
Author:
James R. McGuigan, R. Charles Moyer, Frederick H.deB. Harris
Publisher:
Cengage Learning
Managerial Economics: Applications, Strategies an…
Economics
ISBN:
9781305506381
Author:
James R. McGuigan, R. Charles Moyer, Frederick H.deB. Harris
Publisher:
Cengage Learning