Music streaming services are the most popular way to listen to music. Data gathered over the last 12 months show Apple Music was used by an average of 1.76 million households with a sample standard deviation of 0.55 million family units. Over the same 12 months Spotify was used by an average of 2.27 million families with a sample standard deviation of 0.29 million. Assume the population standard deviations are not the same. Using a significance level of 0.02, test the hypothesis of no difference in the mean number of households picking either service. a. What are the null and alternate hypotheses? Ho: HApple= HSpotify Hh: HApple# HSpotify Ho: HApple+ HSpotify Hh: HApple=HSpotify O Ho: HApple> HSpotify Hh: HApple+ µSpotify b. Compute the test statistic. (Negative values should be indicated by a minus sign. Round your answers to 2 decimal places.) Test statistic
Music streaming services are the most popular way to listen to music. Data gathered over the last 12 months show Apple Music was used by an average of 1.76 million households with a sample standard deviation of 0.55 million family units. Over the same 12 months Spotify was used by an average of 2.27 million families with a sample standard deviation of 0.29 million. Assume the population standard deviations are not the same. Using a significance level of 0.02, test the hypothesis of no difference in the mean number of households picking either service. a. What are the null and alternate hypotheses? Ho: HApple= HSpotify Hh: HApple# HSpotify Ho: HApple+ HSpotify Hh: HApple=HSpotify O Ho: HApple> HSpotify Hh: HApple+ µSpotify b. Compute the test statistic. (Negative values should be indicated by a minus sign. Round your answers to 2 decimal places.) Test statistic

Glencoe Algebra 1, Student Edition, 9780079039897, 0079039898, 2018
18th Edition
ISBN:9780079039897
Author:Carter
Publisher:Carter
Chapter10: Statistics
Section10.4: Distributions Of Data
Problem 3GP

Related questions
Topic Video
Question
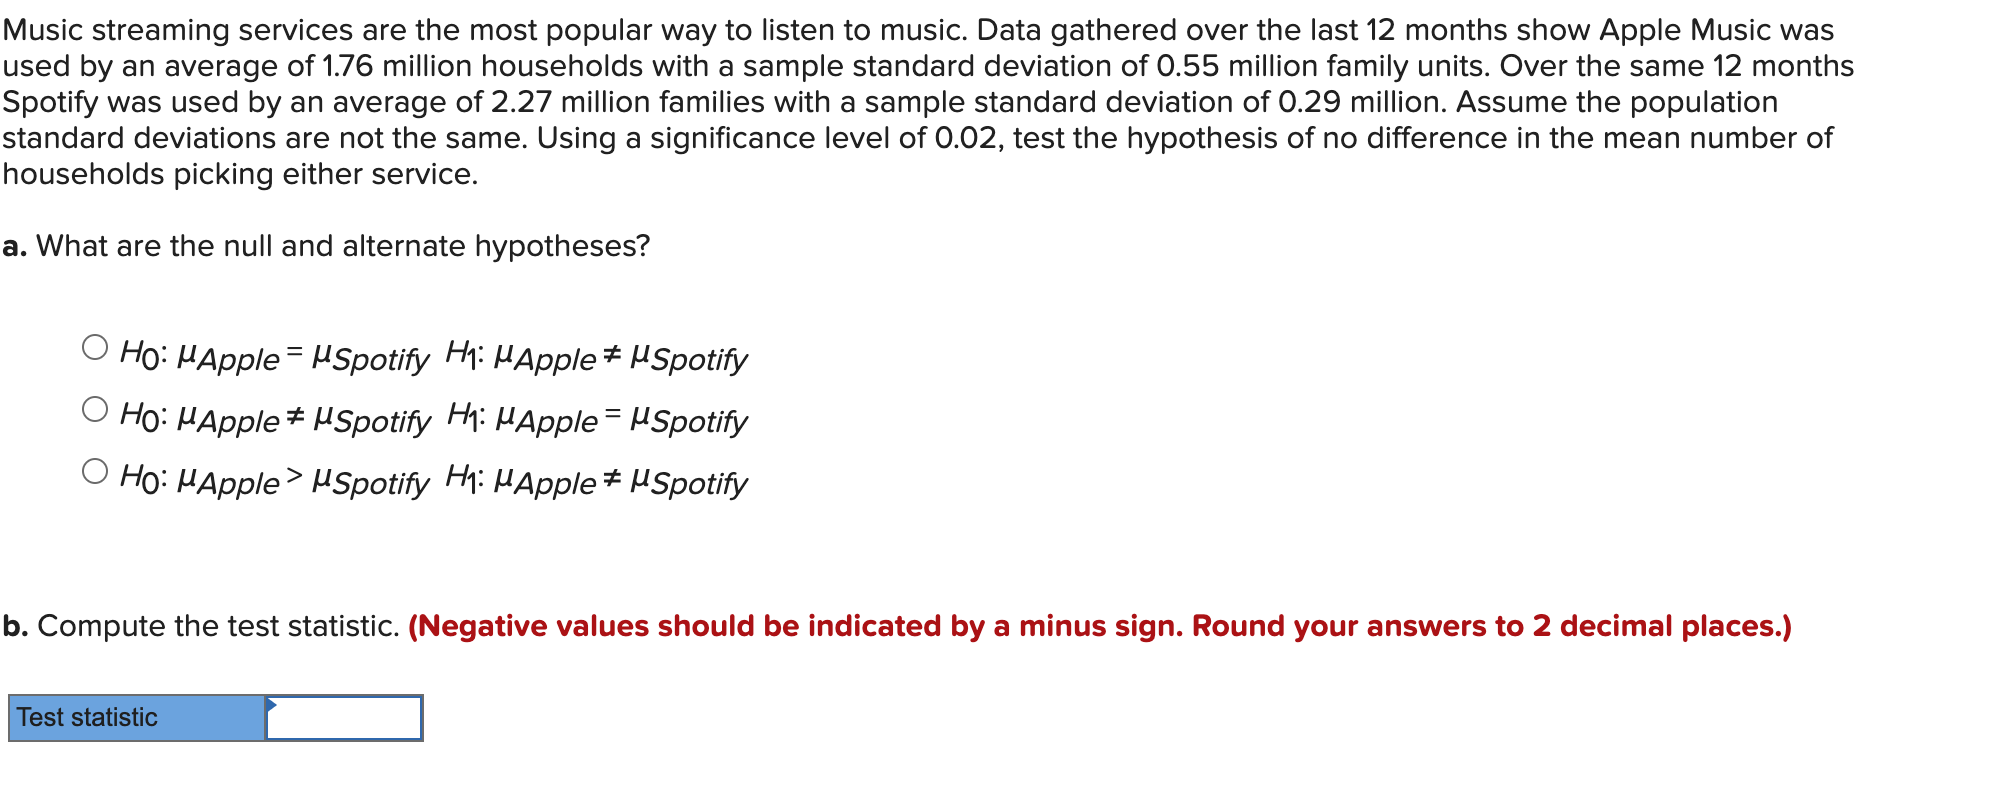
Transcribed Image Text:Music streaming services are the most popular way to listen to music. Data gathered over the last 12 months show Apple Music was
used by an average of 1.76 million households with a sample standard deviation of 0.55 million family units. Over the same 12 months
Spotify was used by an average of 2.27 million families with a sample standard deviation of 0.29 million. Assume the population
standard deviations are not the same. Using a significance level of 0.02, test the hypothesis of no difference in the mean number of
households picking either service.
a. What are the null and alternate hypotheses?
Ho: HApple= HSpotify Hh: HApple# HSpotify
Ho: HApple+ HSpotify Hh: HApple=HSpotify
O Ho: HApple> HSpotify Hh: HApple+ µSpotify
b. Compute the test statistic. (Negative values should be indicated by a minus sign. Round your answers to 2 decimal places.)
Test statistic

Expert Solution
This question has been solved!
Explore an expertly crafted, step-by-step solution for a thorough understanding of key concepts.

This is a popular solution!

Trending now
This is a popular solution!

Step by step
Solved in 2 steps with 3 images

Knowledge Booster


Learn more about
Need a deep-dive on the concept behind this application? Look no further. Learn more about this topic, statistics and related others by exploring similar questions and additional content below.Recommended textbooks for you
Glencoe Algebra 1, Student Edition, 9780079039897…
Algebra
ISBN:
9780079039897
Author:
Carter
Publisher:
McGraw Hill
Glencoe Algebra 1, Student Edition, 9780079039897…
Algebra
ISBN:
9780079039897
Author:
Carter
Publisher:
McGraw Hill