A Statistics instructor wanted to compare the scores on the same final exam given to students at a local community college and local university. The Statistics instructor feels that students at the community college would be better prepared and have higher exam scores on the final exam. After grading the final exams from both institutions, the Statistics instructor found that for a sample of 36 community college students, the sample had a mean score of 84 with a standard deviation of 3.4. A sample of 45 university students had a mean score 79 with a standard deviation of 2.6. Construct a 95% confidence interval for the difference between population mean exam scores. Round your final results to one decimal place. < Mcc - Muniv S
A Statistics instructor wanted to compare the scores on the same final exam given to students at a local community college and local university. The Statistics instructor feels that students at the community college would be better prepared and have higher exam scores on the final exam. After grading the final exams from both institutions, the Statistics instructor found that for a sample of 36 community college students, the sample had a mean score of 84 with a standard deviation of 3.4. A sample of 45 university students had a mean score 79 with a standard deviation of 2.6. Construct a 95% confidence interval for the difference between population mean exam scores. Round your final results to one decimal place. < Mcc - Muniv S

Glencoe Algebra 1, Student Edition, 9780079039897, 0079039898, 2018
18th Edition
ISBN:9780079039897
Author:Carter
Publisher:Carter
Chapter10: Statistics
Section10.4: Distributions Of Data
Problem 7PPS

Related questions
Question
The question is attached in an image.
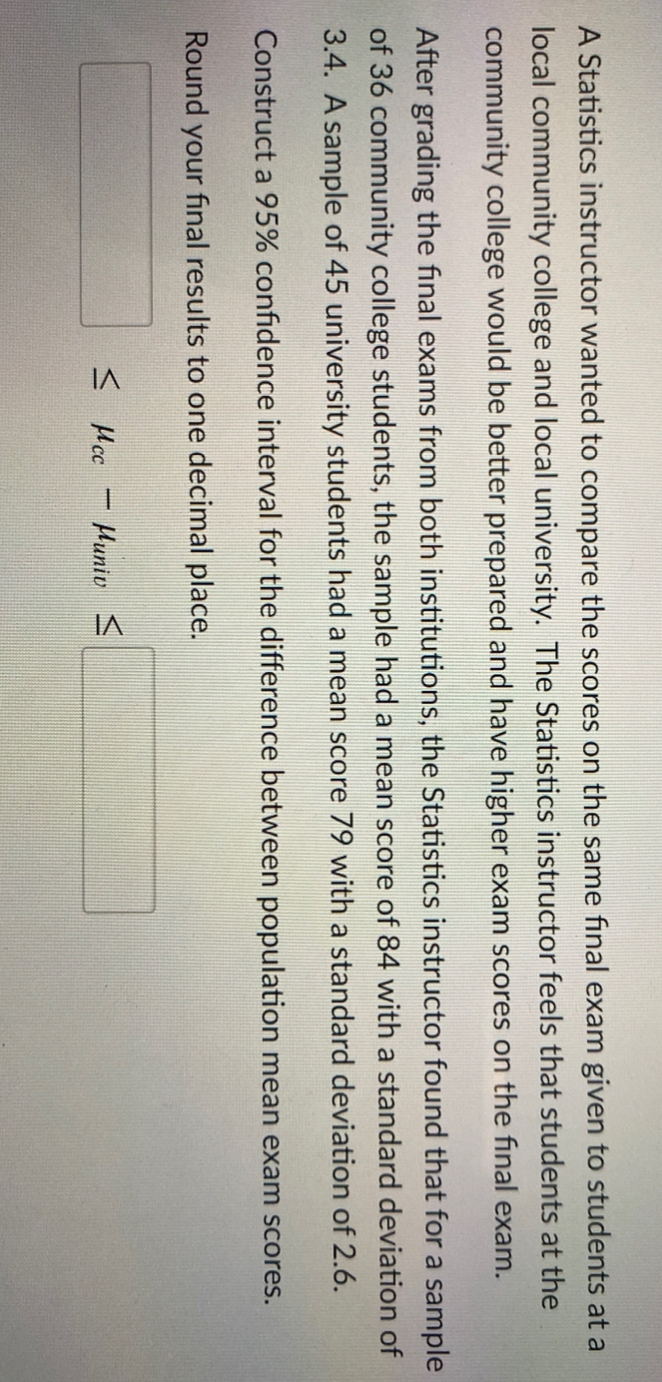
Transcribed Image Text:A Statistics instructor wanted to compare the scores on the same final exam given to students at a
local community college and local university. The Statistics instructor feels that students at the
community college would be better prepared and have higher exam scores on the final exam.
After grading the final exams from both institutions, the Statistics instructor found that for a sample
of 36 community college students, the sample had a mean score of 84 with a standard deviation of
3.4. A sample of 45 university students had a mean score 79 with a standard deviation of 2.6.
Construct a 95% confidence interval for the difference between population mean exam scores.
Round your final results to one decimal place.
< Mcc - Muniv S
Expert Solution
This question has been solved!
Explore an expertly crafted, step-by-step solution for a thorough understanding of key concepts.

This is a popular solution!

Trending now
This is a popular solution!

Step by step
Solved in 2 steps with 1 images

Knowledge Booster


Learn more about
Need a deep-dive on the concept behind this application? Look no further. Learn more about this topic, statistics and related others by exploring similar questions and additional content below.Recommended textbooks for you
Glencoe Algebra 1, Student Edition, 9780079039897…
Algebra
ISBN:
9780079039897
Author:
Carter
Publisher:
McGraw Hill
Glencoe Algebra 1, Student Edition, 9780079039897…
Algebra
ISBN:
9780079039897
Author:
Carter
Publisher:
McGraw Hill