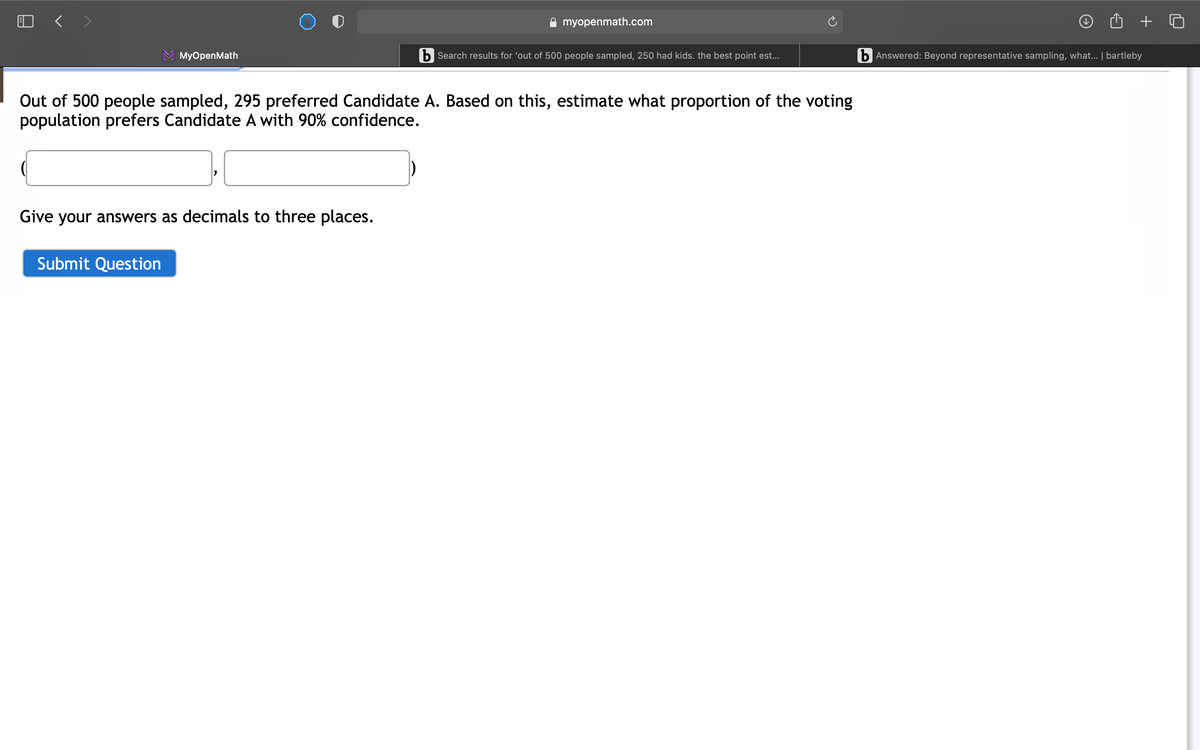
MyOpenMath b Search results for 'out of 500 people sampled, 250 had kids. the best point est. b Answered: Bey Out of 500 people sampled, 295 preferred Candidate A. Based on this, estimate what proportion of the voting population prefers Candidate A with 90% confidence. Give your answers as decimals to three places. Submit Question


Q: Out of 500 people sampled, 250 had kids.The best point estimate for p is? The margin of error for a ...
A: Given Information: Out of 500 people sampled, 250 had kids. n = 500, x = 250 Point estimate for popu...
Q: For random samples of size n=16 selected from a normal distribution with a mean of μ=75 and a standa...
A: Given data: The normally distributed population has mean and standard deviation as: μ=75σ=20 Sample ...
Q: eA stapler is used to staple 100 papers, it jams 5 times during the trial. A different brand of stap...
A:
Q: The Central Intelligence Agency (CIA) has specialists who analyze the frequencies of letters of the ...
A: It is given that n is 2600 and p is 0.127.
Q: Which of the following pairs of variables is likely to have a positive correlation? Check all that a...
A: Correlation between two variables measure the strength and direction between two variables. It measu...
Q: Compute the test statistic and p-value. See picture
A: Given Information: p = 41% = 0.41, p^ = 32% = 0.32, n = 55 Calculation of the test statistic: Formul...
Q: Assume it was determined from a random sample of customers that the probability of buying cake is 40...
A: From the provided information, The probability of buying cake is 40% that is P (C) = 0.40 (C represe...
Q: n this problem, you are to test the validity of your forecasting model. Here are the forecasts for a...
A: Solution to a) Deviation=Actual - Forecast Absolute Deviation= | Deviation | Week Forecast Actu...
Q: A,B,C
A: F : female , S : speeding 18% of the drivers were female 89% drivers were speeding Of those who we...
Q: a. Sketch a scatter plot showing the six data points. b. Just looking at the scatter plot, estimate ...
A: It is asked to draw scatter plot for the given data set. It can be easily drawn by using MS-Excel. P...
Q: N = x Leaf unit = 1 5 2 33444 11 2 668899 (1...
A: From the above stem and leaf plot we can see that two data sets are given , let's write both one by ...
Q: From a sample of 200 of a grocery store's customers, 30% visit the store at least once per week. Th...
A:
Q: A particular fruit's weights are normally distributed, with a mean of 637 grams and a standard devia...
A: The Z-score of a random variable X is defined as follows: Z = (X – µ)/σ. Here, µ and σ are the mean ...
Q: Based on a poll, 50% of adults believe in reincarnation. Assume that 8 adults are randomly selecte...
A:
Q: A researcher wishes to estimate the proportion of adults who have high-speed Internet access. What s...
A:
Q: The table below shows the number of state-registered automatic weapons and the murder rate for sever...
A:
Q: Use the following cell phone airport data speeds (Mbps) from a particular network. Find Q3. ...
A: 0.1 0.2 0.2 0.3 0.3 0.3 0.3 0.5 0.5 0.5 0.6 0.7 0.8 0.8 0.9 0.9 1.2 ...
Q: A particular manufacturing design requires a shaft with a diameter of 23.000 mm, but shafts with dia...
A: From the Standard normal table, the value of z for the area to the right of 1% is 2.326.
Q: At a drug rehab center 37% experience depression and 30% experience weight gain. 15% experience both...
A: Hey there! Thank you for posting the question. Since your question has more than 3 parts, we are sol...
Q: Use R to find the following probabilities:a) Pr{Z < 4.05} b) Pr{Z > -0.75} c) Pr{-1.35 < Z ...
A: Here, we consider Z as a standard normal distribution, i.e., Z~N(0,1). Theoretically, a.)P[Z<4.05...
Q: Too Young to Tat Based on a Harris poll, among adults who regret getting tattoos, 20% say that they ...
A: Among adults who regret getting tattoos, 20% say that they were too young when they got their tattoo...
Q: 1. The number of cubic yards of dirt, D, needed to cover a garden with area a square feet is given b...
A:
Q: A textile manufacturer wants to set up a control chart for irregularities (e.g., oil stains, shop so...
A: c-chart is used for defects and it follows Poisson distribution with parameter λ. Then, Ec=λS.D.c=λ ...
Q: Bighorn sheep are found in the mountainous western United States. In the following data, x = the ag...
A: The correlation coefficient formula is, r=n∑ixy-∑ix∑iyn∑ix2-∑ix2n∑iy2-∑iy2
Q: bability that over 40% will be willing to switch comp t/closest answer to account for minor rounding...
A: Let Xi be a random variable such that Xi=1, if ith executive is willing to switcch0 otherwise Xi=1,...
Q: You want to obtain a sample to estimate a population proportion. Based on previous evidence, you bel...
A:
Q: A doctor’s office studied the length of time that their patients wait in the waiting room before bei...
A: Sample mean, x¯=1∑ifi∑fiixi, where fi is the frequency of the i-th observation Sample standard devia...
Q: Study shows that 69% of people are more protective of their information while on wireless internet. ...
A:
Q: A group conducted a poll of 2017 likely voters just prior to an election. The results of the survey ...
A: Given: Margin of error = 2% Vote received by candidate A = 46% Vote received by candidate B = 45%
Q: 16% of individuals insured by AllState have received at least one traffic ticket. For a sample of 1...
A: From the provided information, 16% of individuals insured by All State have received at least one tr...
Q: QUESTION 6 The following is a payoff table giving profits for various situations. State 1 St...
A: Expected monetary value: Under the expected monetary value criterion, an individual chooses the alte...
Q: All the possible samples of n = 4 scores are selected from a population with µ = 20. If the average ...
A: Given information, All the possible samples of n = 4 scores are selected from a population with µ = ...
Q: Flip a coin twice. Create the sample space of possible outcomes. Group of answer choices a){ HH, HT,...
A: The sample space is a set of all possible outcomes of the experiment.
Q: Adverse childhood experiences (ACEs) are traumatic events occurring before age 18. ACEs include all ...
A: Here to state the hypotheses.
Q: A nutritionist conducted a study on the eating patterns of early adolescent boys and girls. Calorie ...
A: A nutritionist conducted a study on the eating patterns of early boys and girls. Calorie intake is n...
Q: Given the data below: x̄ = 50, s= 6, n = 25 A 95% confidence interval would be 50 ± _______(round yo...
A: From the provided information,
Q: A nutritionist conducted a study on the eating patterns of early adolescent boys and girls. Calorie ...
A: GivenFor boysThe mean calories per day =3300standard deviation =790 For girlsThe mean calories per d...
Q: A sample of average high temperature during July (x) of cities in Colorado compared to their elevati...
A: The correlation coefficient can be obtained by excel function as follow: Enter the data into excel ...
Q: Eyeglassomatic manufactures eyeglasses for different retailers. They test to see how many defective...
A: The total number of defective lenses is sum of all defects n(s) = 5865+4613+1992+1838+1596+1546+1485...
Q: The joint probability mass function (pmf) of two discrete random variables Xand Y is given below: y ...
A: Here, X takes values between 0 and 1, while Y takes values between and 2. If we define Z=XY, then t...
Q: Determine the point estimate of the population proportion, the margin of error for the following con...
A:
Q: Using technology to randomly secelting two numbers form 1 to 6. Find the sum and subtract 1 to obtai...
A: Given info: Use technology to randomly select two numbers from 1 to 6. Find the sum of generated num...
Q: Suppose that you have 8 green cards and 5 yellow cards. The cards are well shuffled. You randomly dr...
A:
Q: What methods could an environment geographer use to investigate the relationship between acidity lev...
A: To find the type of relationship between two variables, strength of the relationship or association,...
Q: A. What is percentage of women who meet the height requirement? B. What is the new height requireme...
A: Given that, The women's heights are normally distributed with mean 63.8 in and standard deviation 2....
Q: The responses of 1166 voters to a survey about the way the media conducted themselves in a recent po...
A: Here, total number of voters surveyed is 1166. Hence, n=1166 a.) Let A1 be the event such that a per...
Q: On the SAT, the average Writing score is 490 points and the average Math score is 547 points. The st...
A: From the provided information, Average Math score (µ) = 547 points Standard deviation (σ) = 89 point...


Trending now
This is a popular solution!

Step by step
Solved in 2 steps with 1 images


- During the 2004 election year, new polling results were reported daily. In anIBD/TIPP poll of 910 adults, 503 respondents reported that they were optimistic aboutthe national outlook, and President Bush’s leadership index jumped 4.7 points to 55.3(Investor’s Business Daily, January 14, 2004). What is the sample proportion of respondents who are optimistic about thenational outlook? A campaign manager wants to claim that this poll indicates that the majority ofadults are optimistic about the national outlook. Construct a hypothesis test sothat rejection of the null hypothesis will permit the conclusion that the proportionoptimistic is greater than 50%. Use the polling data to compute the p-value for the hypothesis test in part (b).Explain to the manager what this p-value means about the level of significance ofthe results.A researcher wanted to measure if the voting preferences between the brand of soaps are the different using 5% level of significance. Assume the data is normally distributed.900 voters in the town and found that 70% of the residents favored construction. Using the data, a political strategist wants to test the claim that the percentage of residents who favor construction is over 66%. Determine the P-value of the test statistic.
- Recently, the number of airline companies that offer in-flight Wi-Fi service to passengers has increased. However, it is estimated that only 10% of the passengers who have Wi-Fi available to them are willing to pay for it. Suppose Gogo, the largest provider of airline Wi-Fi service, would like to test this hypothesis by randomly sampling 125 passengers and asking them if they would be willing to pay $4.95 for 90 minutes of onboard Internet access. Twenty passengers indicated they would. Using α = 0.05, anwer the following questions: a. Based on this sample, can we conclude that the proportion of airline passengers willing to pay for onboard Wi-Fi service is different than 10%? b. Determine the p-value for this test.The Institute of Education Sciences measures the high school dropout rate as the percentageof 16-through 24-year-olds who are not enrolled in school and have not earned a high schoolcredential. Last year, the high school dropout rate was 8.1%. A polling company recently took asurvey of 1,000 people between the ages of 16 and 24 and found that 6.5% of them are highschool dropouts. The polling company would like to determine whether the dropout rate hasdecreased at a 5% significance level[11] After carrying out Kruskal Wallis test, the voting preferences in terms of ranked presidentiable candidates from Albay, Mindoro and Palawan were found to be statistically different. Is there a need to do a post-hoc test for this? Explain. Yes: No:
- In order to estimate the proportion of students that text while driving, a school administrator selects a simple random sample of students from a list of all students at the school who have parking permits. The students are called to the office, one at a time. The administrator asks each student, “Do you text while driving, even though you are not supposed to?” Based on the survey, the administrator estimates that only 2% of students with parking passes text while driving. What potential bias is present in the design of this survey and what is the likely direction of the bias? (A) The sample proportion is likely an underestimate of the population proportion due to response bias. (B) The sample proportion is likely an underestimate of the population proportion due to undercoverage. (C) The sample proportion is likely an underestimate of the population proportion due to nonresponse. (D) The sample proportion is likely an overestimate of the population proportion due to response bias.…Out of 600 people sampled, 132 preferred Candidate A. Based on this, estimate what proportion of the voting population prefers Candidate A with 95% confidence.You’ve been hired as a consultant for Spotifly to conduct a survey for them regarding customer satisfaction. From a random selection and poll of 1000 individuals (out of their 718,000 customers), you found that 63% were HIGHLY SATISFIED with Spotifly’s services. Surprisingly, the management team of Spotifly is furious with you and, as they are kicking you out of their building, they yell “At Spotifly, our customers love us! Everyone knows that two-thirds of our customers are HIGHLY SATISIFIED with us!” Hmm… is that really the case? That is, assuming they are right, then how likely is it to observe poll results so far below the true “high satisfaction” rate? (three decimals)
- A sample n=4 with scores 42,38,40 and 25 was randomly selected from a population with scores 55,42,46,45,38,49,40,50,40,42,38,35,29,25, what would be the sampling error involved in the selection?A researcher published this survey result: "74% of people would be willing to spend 10 percent more for energy from a non-polluting source". The survey question was announced on a national radio show and 1200 listeners responded by calling in. Determine whether the study involves selection bias, participation bias, both selection bias and participation bias, or neither. Also describe how the bias would affect the results.A market research group is interested in estimating the market share of three airline companies, A, B and C, operating on a particular flight path. These three airlines are the only companies operating on this route. Airline B claim that they have 50% of the business with the remaining percentage shared equally amongst airlines A and C, i.e. 25% each. The market research group decide to carry out an independent study and question a random sample of 97 people visiting an airport on a particular day. Each person was given price, timetables and service details of flights on this route for each of the three airlines. Provided with this information they were asked to select their airline of choice.The survey revealed the following observed frequencies Airline A - 26 Aurline B - 49 Airline C - 22 Test if there is any evidence to suggest that the airline's claim is incorrect, at significance level α = 0.05. Complete the test by answering the following questions : Which of the following is the…