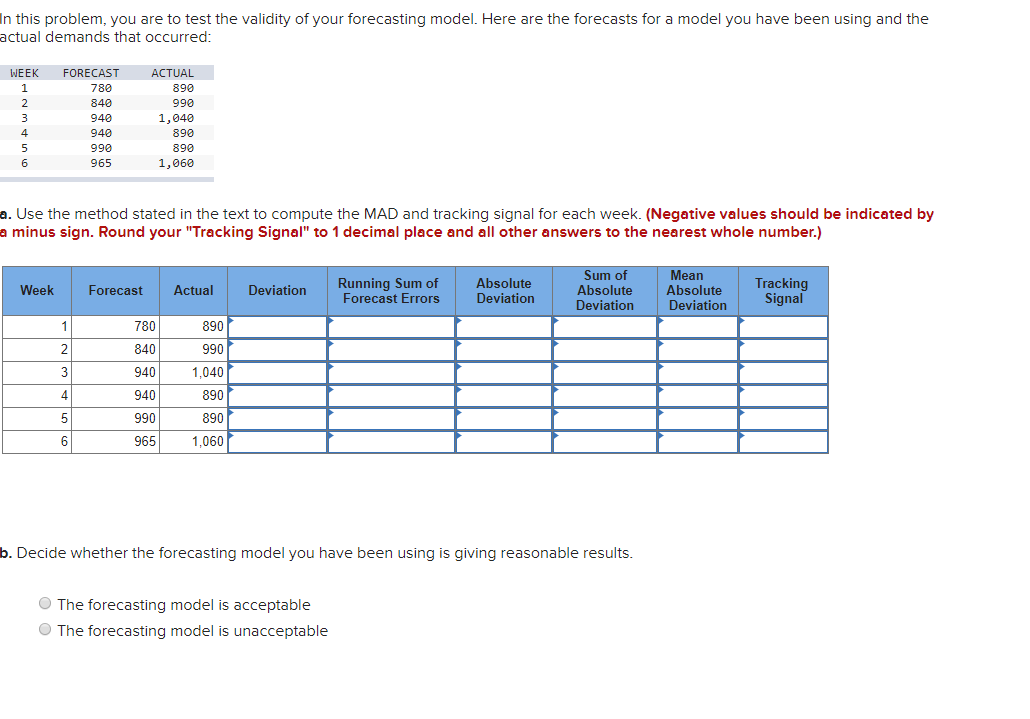
n this problem, you are to test the validity of your forecasting model. Here are the forecasts for a model you have been using and the actual demands that occurred: WEEK FORECAST АCTUAL 780 890 2. 840 990 940 1,040 4 940 890 5 990 890 6 965 1,060 a. Use the method stated in the text to compute the MAD and tracking signal for each week. (Negative values should be indicated by a minus sign. Round your "Tracking Signal" to 1 decimal place and all other answers to the nearest whole number.) Running Sum of Forecast Errors Absolute Deviation Sum of Absolute Deviation Mean Absolute Deviation Tracking Signal Week Forecast Actual Deviation 780 840 1 890 2 990 940 1,040 4. 940 890 990 890 965 1,060 o. Decide whether the forecasting model you have been using is giving reasonable results. The forecasting model is acceptable The forecasting model is unacceptable LO


Correlation
Correlation defines a relationship between two independent variables. It tells the degree to which variables move in relation to each other. When two sets of data are related to each other, there is a correlation between them.
Linear Correlation
A correlation is used to determine the relationships between numerical and categorical variables. In other words, it is an indicator of how things are connected to one another. The correlation analysis is the study of how variables are related.
Regression Analysis
Regression analysis is a statistical method in which it estimates the relationship between a dependent variable and one or more independent variable. In simple terms dependent variable is called as outcome variable and independent variable is called as predictors. Regression analysis is one of the methods to find the trends in data. The independent variable used in Regression analysis is named Predictor variable. It offers data of an associated dependent variable regarding a particular outcome.


Trending now
This is a popular solution!

Step by step
Solved in 3 steps


