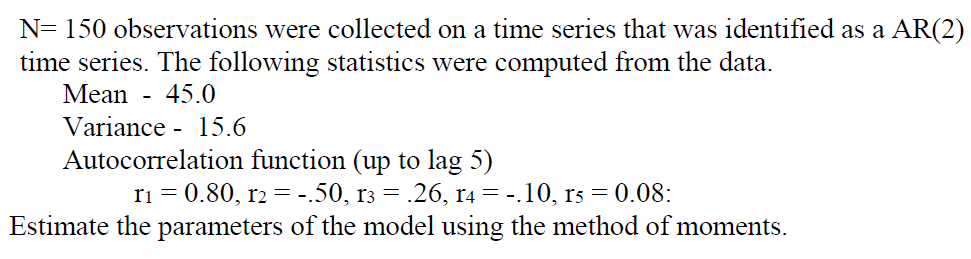
N= 150 observations were collected on a time series that was identified as a AR(2) time series. The following statistics were computed from the data. Mean - 45.0 Variance 15.6 Autocorrelation function (up to lag 5) r1 = 0.80, r2 = .50, rз = .26, r4 = -.10, rs = 0.08: == Estimate the parameters of the model using the method of moments.


Q: A manager gathers some demographic information from the store's customers. The following chart…
A: a) 140/447b) 233/447c) 94/447Explanation:We have the data:AgeNumber of…
Q: A researcher wishes to estimate, with 90% confidence, the population proportion of adults who…
A: a) the minimum sample size required is 271b) the minimum sample size required is 192c) Having an…
Q: A geological study indicates that an exploratory oil well should strike oil with probability 0.4.…
A: To determine the probability in different scenariosTo determine the mean and variance
Q: 84. The figure below is a bootstrap distribution that was generated for a sample correlation 0.25…
A: 84. (a) To estimate the value of the sample statistic using the bootstrap distribution, we can…
Q: To further elaborate the regression model, the researchers of the research project identified that…
A: Please note that only sub parts A and B are solved because sub parts C and D require external…
Q: We can calculate the following probabilities using the standard normal distribution: 1) Pr(Z z) =…
A: The given z-score is 0. By using the standard normal distribution the probabilities are obtained.
Q: Out of 600 people sampled, 570 had children. Based on this, construct a 99% confidence interval for…
A: 1) Yes, here 570 <= 5% is satisfied. 2) Here n = 600 and sample proportion is given as,…
Q: In 20162016, the Chicago Cubs defeated the Cleveland Indians to become the champions of Major League…
A: The salaries of the players in the Chicago Cubs institution are listed twice. To provide a more…
Q: A student was asked to find a 95% confidence interval for widget width using data from a random…
A: The answer is the Last Option: With 95% confidence, the mean width of all widgets is between 12 and…
Q: AutoSave Home Insert Draw Design Layout References Mailings Review View Developer Times New... ✓ 12…
A: Solved and explained in detail below.Explanation: a) The systolic blood pressure (SBP) levels of…
Q: In a research study both teacher and parents rated their students' in terms of their eagerness to…
A: The objective of the question is to determine the most appropriate statistical test to use in a…
Q: 6) We have a logistic regression model that computes the probability p(x) that a given input a…
A: The objective of the question is to understand the relationship between the threshold value (θ),…
Q: Fifteen items or less: The number of customers in line at a supermarket express checkout counter is…
A: The question is about discrete probability distribution.Given :
Q: 17
A: a) 200b) 180 Explanation:To find the expected number of citrus trees showing damage in orchards of…
Q: Any correct answers and tell me why and how?
A: If the mean of the gray scale value is less than 87, classify the photo as day, else classify the…
Q: 2. Show that a Uniform(0, 0) random variable is not an exponential family distribution.
A: A joint probability mass function or joint probability density function, {f(x|θ;θ=(θ1,θ2,...θn)∈Θ}…
Q: Let Y₁, Y2, . . ., Yn denote a random sample from a normal distribution with known mean μ and…
A:
Q: A sample is drawn from a population, and the mean of the sample is computed. For example, from the…
A: The mean gives an idea of the average value of the given data.
Q: In a randomized controlled trial, insecticide-treated bednets were tested as a way to reduce…
A: The provided information is as follows:The number of infants using bednets is .The number of infants…
Q: 21
A: z*=2.326 The sketch is shown below. Explanation:Determine the value of z* such that -z* and z*…
Q: Jake just learned to identify the difference between an oak tree and a maple tree. He was curious…
A: 1st with the help of column % of ponds we find column total of maple Let y be column total of…
Q: Match the scenarios with the appropriate measure of central tendency that should be used to compute…
A: So, the matches would be:Scenario 1: ModeScenario 2: ModeScenario 3: Median Explanation: 1. Trying…
Q: Consider the following table: Among Treatments Error Total SS DF MS F 8 1.76 2031 4882.92 18 Step 7…
A: critical value of F = 2.3772 Explanation:given: SSDFMSFAmong Treatments 8 1.76Error2031…
Q: The estimated regression equation for this data is ŷ = 21.588629 +0.334114x, where x = price ($) and…
A: a.The data related to the price and the overall score of stereo headphones are given.The independent…
Q: The fill amount of bottles of a soft drink is normally distributed, with a mean of 2.0 liters and a…
A: " Since you have posted a question with multiple subparts we will provide solutions only to the…
Q: Which of the following is not true when using the confidence interval method for testing a claim…
A: The question is about testing a claim on the basis of confidence interval.Introduction :Confidence…
Q: Your flight has been delayed: At Denver International Airport, 70% of recent flights have arrived…
A: The objective of this question is to find the probability that all 10 flights in a sample were on…
Q: In a survey of 2922 adults, 1469 say they have started paying bills online in the last year.…
A: A 99% confidence interval for the population proportion is (0.479, 0.527). Interpretation: We are…
Q: Section Exercise 9-33 (Static) Find the p-value using Excel (not Appendix D): (Round your answers to…
A: p-valuep-value(Round to 4 decimal places)Right-tailed testt = 1.457, d.f =…
Q: In a linear regression model, the dependent variable is "Final exam score (%) for WPC 300" and the…
A: Dependent variable is Final exam score for WPC 300.Independent variable is Hours studied.Coefficient…
Q: The mean value of the weight of product X is normally distributed with average (0.297 kg) and…
A: Given,The mean value of the weight of product X is normally distributed with average (μ) = 0.297 kg…
Q: In a survey of 2318 adults, 747 say they believe in UFOs. Construct a 99% confidence interval for…
A: The 90% confidence interval for the population proportion is between (0.297,…
Q: 1.) What is the mean for the following values of the variable race, represented by: 1-African…
A: Since you have asked multiple questions, we will solve the first question for you. If you want any…
Q: Can you help me interprate this data And explain i am very confused? Per our study, .1 - .3 is a…
A: The correlation shows a relationship between 2 variables. Correlation is often used to determine how…
Q: (a) Compute the mean Hx (b) Compute the standard deviation σx. (c) If each customer takes 3 minutes…
A: Let X be the random variable that is the number of customers in line.Given…
Q: I need solutions and answers
A: By using the given visual representation, we discover that:1. If the average saturation value is…
Q: Using the information can you help me solve parts h and i. If you could include instructions for…
A: The question is about regression analysis.The data on y=survival rate ( percent ) and x=mean call to…
Q: An investor has $100,000 to invest this year. One option is to purchase a guaranteed investment…
A: The amount of guaranteed return for an option is 1.8%.The option is specified to yield a 5% increase…
Q: Suppose you won the lottery and had two options: (1) receiving $0.3 million or (2) taking a gamble…
A: Since you have posted a question with multiple sub-parts, we will solve the first three sub-parts…
Q: A researcher wishes to estimate, with 95% confidence, the population proportion of adults who think…
A: (a) When no preliminary estimate is available:The minimum sample size needed without a preliminary…
Q: Which confidence level would give the narrowest margin of error
A: The objective of the question is to understand the relationship between the confidence level and the…
Q: In a research study both teacher and parents rated their students' in terms of their eagerness to…
A: The objective of the question is to identify the most appropriate statistical test to compare the…
Q: Consider a renewal process for which the lifetimes X1, X2, . . . are iid Poisson random variables…
A: The Final Answer:(a) Probability mass function of W5: We know that each Ti follows a Poisson…
Q: An investor has $100,000 to invest this year. One option is to purchase a guaranteed investment…
A: The objective of this question is to determine the best investment option for the investor based on…
Q: A starter motor used in a space vehicle has a high rate of reliability and was reputed to start on…
A: 0.9926Explanation:The probability of at least one failure is the same as 1 minus the probability of…
Q: The Accuweather website reports that the daily high temperature in Calgary for the month of October…
A: The objective of the question is to find the probabilities and percentages related to the daily high…
Q: Place the following data in a stem and leaf plot. 137 129 116 114 130 121 124 135 139 132 117 You…
A: There are total 11 observations.The data is arranged ascending order.That is, 114, 116, 117, 121,…
Q: 2. An investigator has a colony of N = 763 rats that have been subjected to a standard drug. The…
A: Please refer below pages.If you have any questions feel free to ask.Explanation:Step 1: Step 2: Step…
Q: AutoSave Developer W= LabVI Tell me Home Insert Draw Design Layout References Mailings Review View…
A: A1.1. For the hypotheses, we have the following notation where the values are in thousands of…
Q: Question Completion Status: Blood Sugar Level Frequency 15-19 3 20-24 9 25-29 6 14 30-34 35-39 The…
A: Given frequency distribution table is :Blood sugar levelFrequency (f)15-19320-24925-29630-341435-398

Step by step
Solved in 1 steps

- Respiratory Rate Researchers have found that the 95 th percentile the value at which 95% of the data are at or below for respiratory rates in breath per minute during the first 3 years of infancy are given by y=101.82411-0.0125995x+0.00013401x2 for awake infants and y=101.72858-0.0139928x+0.00017646x2 for sleeping infants, where x is the age in months. Source: Pediatrics. a. What is the domain for each function? b. For each respiratory rate, is the rate decreasing or increasing over the first 3 years of life? Hint: Is the graph of the quadratic in the exponent opening upward or downward? Where is the vertex? c. Verify your answer to part b using a graphing calculator. d. For a 1- year-old infant in the 95 th percentile, how much higher is the walking respiratory rate then the sleeping respiratory rate? e. f.A random sample of 102 observations is selected to estimate the relationship between the price of a used car (y) and its odometer readings (x). The estimated simple regression line is: ý = 6533 – 0.03x (0.004) where the value 0.004 in bracket is the standard error of the point estimator for the slope in the regression model. Question 15. What percent of the variability of the used car values can be explained using this model? O 60% O 36% O 80% O 64% O 95% O o o o10) A regression was run to determine if there is a relationship between hours of TV watched per day (x) and number of situps a person can do (y).The results of the regression were:y=ax+b a=-0.767 b=31.009 r2=0.609961 r=-0.781 Use this to predict the number of situps a person who watches 7.5 hours of TV can do (to one decimal place)
- Consider a linear regression model for the decrease in blood pressure (mmHg) over a four-week period with muy=2.8+0.8x and standard deviation chi=3.2. The explanatory variable x is the number of servings fruits and vegetables in a calorie-controlled diet. The decrease in blood pressure y will vary about this subpopulation mean. What is the distribution of y for this subpopulation?When the errors in a regression model have AR(1) serial correlation, why do the OLS standard errors tend to underestimate the sampling variation in the B;? Is it always true that the OLS standard errors are too small?find the (a) explained variation, (b) unexplained variation, and (c) indicated prediction interval. In each case, there is sujficient evidence to support a claim of a linear correlation, so it is reasonable to use the regression equation when making predictions. Altitude and Temperature Listed below are altitudes (thousands of feet) and outside air temperatures (°F) recorded by the author during Delta Flight 1053 from New Orleans to Atlanta. For the prediction interval, use a 95% confidence level with the altitude of 6327 ft (or 6.327 thousand feet).
- This table reports the regression coefficients when the returns of the size-institutionalownership portfolio (columns 1 and 2) returns are regressed on three variables: a constant(column 3), the stock market returns (column 4), and the change of the value weighted discountof the closed end fund industry (column 6). Columns 5 and 7 report the corresponding t-statistics of the coefficient estimates. Note that a t-statistic with an absolute value above 1.96means the coefficient estimate is significantly different from 0 at the 1% level. Column 8reports the R square of the regressions. Column 9 reports the mean institutional ownership ofeach portfolio. The last column reports the F-statistics for a multivariate test of the null hypothesis that the coefficient on ΔVWD in the Low (L) ownership portfolio is equal to theHigh (H) ownership portfolio. Two-tailed p-values are in parentheses. 1. What is the main finding of this Table? 2. What is the explanation for…The table below lists measured amounts of redshift and the distances (billions of light-years) to randomly selected astronomical objects. Find the (a) explained variation, (b) unexplained variation, and (c) indicated prediction interval. There is sufficient evidence to support a claim of a linear correlation, so it is reasonable to use he regression equation when making predictions. For the prediction interval, use a 90% confidence level with a redshift of 0.0126. Redshift 0.0233 0.0543 0.0716 0.0396 0.0436 0.0107 Distance 0.34 0.74 0.99 0.56 0.62 0.12 a. Find the explained variation. Round to six decimal places as needed.)Consider a linear regression model for the decrease in blood pressure (mmHg) over a four-week period with muy=2.8+0.8x and standard deviation chi=3.2. The explanatory variable x is the number of servings fruits and vegetables in a calorie-controlled diet. What is the subpopulation mean when x = 7 servings per day?
- For each gender, estimate an earnings regression where the dependent variable is Annual Earnings and the independent variable is Age. Report the results for each regression, and provide an interpretation of the coefficient associated with age. Female- annual earning: 49347.58 age: 42.81 education: 14.4 Male- Annual earning: 69984.54 age: 42.86 education: 14.11.Q.8). In a regression calculation, a researcher finds that the explanatory variable x has mean 100 and SD 10, and the response variable y has mean 250 and SD 40. The regression equation is found to be y^ = 450 and y? 2x. What is the correlation between x (a) cannot tell from the information available (b) -0.8 (c) -0.5 (d) 0.4 (e) 0.1 Q.10) a) What are the differences between the data and information? b) Explain the differences between the types of StatisticsIn a partially destroyed laboratory, record of an analysis of correlation, data, the following results only are legible:Variance of X=9. Regression equation: 8X –10Y + 66=0, 40X–18Y = 214.(1) the mean value X and Y,(2) the correlation coefficient between X and Y, and (3) the standard deviation of Y ?