n organization advocating for tax simplification has proposed the implementation of an alternative flat tax system to replace the existing Federal income tax. Featuring a very simple two-line tax form – How much money did you make? Send it In an attempt to identify the partisan nature of support for their proposal, the tax reformers have conducted a simple survey. They collected random samples of n1 = 120 Republican voters and n2 = 80 Democrat voters, polled the sampled respondents and noted for each group the number of voters who favor the flat tax propos


An organization advocating for tax simplification has proposed the implementation of an alternative flat tax system to replace the existing Federal income tax.
Featuring a very simple two-line tax form –
- How much money did you make?
- Send it
In an attempt to identify the partisan nature of support for their proposal, the tax reformers have conducted a simple survey. They collected random samples of
n1 = 120 Republican voters and n2 = 80 Democrat voters, polled the sampled respondents and noted for each group the number of voters who favor the flat tax proposal. The results of the survey are summarized in the table below.
|
Political Affiliation |
Favor (X) |
Total (n) |
Proportion (X/n) |
|
Republican |
90 |
120 |
p-hat1 = 90/120 = 0.75 |
|
Democrat |
50 |
80 |
p-hat2 = 50/80 = 0.625 |
|
Total |
140 |
200 |
p-hat = 140/200 = 0.700 |
Required Parts
a. Initial concerns are for assessing the level of support among Democrats in particular, so for now we focus on the Democrat line (the second line) of the survey summary table. Develop a 95% confidence
b. Our flat tax heroes, concerned with the precision (or possible lack thereof) of the estimated proportion of Democrats in favor, are considering how a follow up study might estimate more precisely the proportion of Democrats in favor of the flat tax. How large a sample of Democrats should be selected to estimate the proportion in favor to within plus-or-minus 0.05 with 95% confidence? Note that the already existing study summarized above provides a source of planning information for the contemplated future
c. The bottom-line issue, with respect to Democratic support for the flat tax, is whether or not Democrats, as a group, favor the flat tax. Do the survey data provide sufficient evidence to conclude that the proportion of Democrats favoring the flat tax exceeds 5? Conduct your test at the α = 0.05 level of significance and report the p-value for your test
d. Our tax reformers now turn to a comparative analysis of Republican versus Democratic support for the proposed flat tax. Estimate the difference [Republican - Democrat] between the proportions of individuals who favor the flat tax proposal and develop a 95% confidence interval for the estimated difference.
e. Is there sufficient evidence, based upon the survey data, to conclude that the difference in proportions, [Republican - Democrat], that favor the proposed flat tax is significant (significantly different from zero?) Conduct your test at the α = 0.05 level of significance and report the p-value for your test. Be sure to identify the hypotheses to be tested and state your conclusion in managerial
![Proportions Estimation and Testing Problem
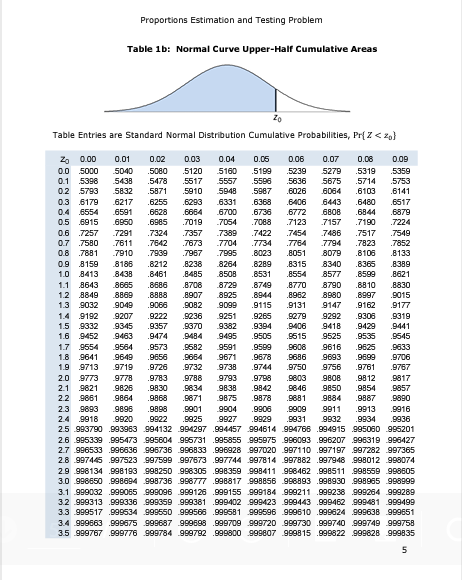
Table 1a: Normal Curve Lower-Half Cumulative Areas
Zo
Table Entries are Standard Normal Distribution Cumulative Probabilities, Pr{Z <zo]
Zo 0.00 0.01 0.02 0.03 0.04 0.05 0.06 0.07 0.06 0.09
-3.5 000233 000224 000216 000208 .000200000193 000185 .000178 .000172 000165
-3.4 000337 .000325 000313 000302 .000291 000280 000270 .000260 000251 000242
-3.3 000483 .000466 000450 000434 .000419 000404 000390 .000376 .000362 000349
-3.2 .000687 .000664 000641 000619 000598 000577 000557 000538 .000519 000501
-3.1 .000968 .000935 000904 000874 000845 .000816 000789 .000762 .000736 000711
-3.0 .001350 .001306 .001264 001223 .001183 .001144 001107 .001070 .001035 .001001
-2.9 001866 .001807 .001750 001695 .001641 .001589 001538 .001489 .001441 001395
-2.8 .002555 .002477 .002401 002327 .002256 002186 002118 .002052 .001988 001926
-2.7 003467 .003364 003264 003167 .003072 002980 002890 .002803 .002718 002635
-26 004661 004527 004396 004269 .004145 004025 003907 003793 .003681 003573
-2.5 006210.006037 .005868 005703 .005543 .005386 005234 005085 004940 004799
-2.4 0062 0080 .0078 .0075 .0073 .0071 .0069
-23 0107 0104 0102 .0099 0096 0094
.0129 0125
0162 0158
0068 0066
.0064
.0091
0089
0067
.0084
-2.2 .0139 0136 0132
0122 .0119 .0116
.0154
-2.1 .0179 0174 0170 .0166
-2.0 .0228 0222
0217
.0212
0207
0202
.0197
-1.9 .0287 0281 0274
0256
.0250
-1.8 .0359 .0351
0322
.0314
-1.7 .0446 .0436 0427
0401 .0392
.0268
0344 .0336
.0418
.0262
.0329
0409
1515
1762
2033
2266
2578
0113
.0150 0146
.0192
0188
-1.6 .0548 .0637
0526 .0516
.0505
0495 .0485
-1.5 .0668
.0618
0606 0594
.0749 0735
.0901 0885 0869 .0853 0638 0823
.1075 1057 1038 .1020 -1003 0965
.1271 .1251 1230 .1210 -1190 -1170
.1492 1469 1446 .1423 1401 1379
1711 1685 .1660
.1736
.1635
1611
.2005
.1977
.1922 .1894
1867
.0655 0643 .0630
-1.4 .0808 .0793 0778 .0764
-1.3 .0968 .0951 0934 0918
-1.2 1151 .1131 1112 1093
-1.1 1357 .1335 1314 1292
-1.0 1587 .1562 1539
-0.9 -1841 .1814 -1788
-0.8 2119 2090 2061
-0.7 2420 2389 2358 2327
-0.6 2743 .2709 2676 2643 .2611
-0.5 3085 .3050 3015 2981
-0.4 3446 .3409 3372 3336
-0.3 3821 .3783 .3745 3707
-0.2 4207 .4168 .4129
4090 4052
-0.1 4602 .4562 .4522 4483 .4443
0.0 5000 .4960 .4920 4880 4840
1949
2236 .2207 2177
.2297
2546 2514 .2483
2946
2912
2877
3264
.3300
3228
.3669 3632 3594
.4013 3974
.0244 0239
.0307 0301
.0384 0375
.4404 4364
.4801
.0475 0465
.0582
0571
0721 .0708
0694
4325
4761 4721
.0110
.0143
.0183
.0233
.0294
0367
0455
0559
0681
2843 2810 2776
.3192 .3156 3121
.3557 3520 3483
3936 .3897 3859
4247
4641
4
.4286
.4681
2148
2451](/v2/_next/image?url=https%3A%2F%2Fcontent.bartleby.com%2Fqna-images%2Fquestion%2F8c4d3022-e777-466b-b729-2581bb326468%2F194fb5bc-b008-4de6-bd01-32dbfc9ab12c%2Fll4gz8o_processed.png&w=3840&q=75)


Trending now
This is a popular solution!

Step by step
Solved in 3 steps with 2 images


