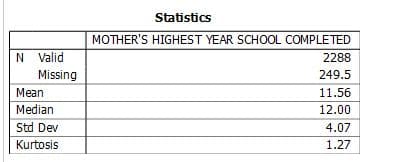
N Valid Missing Mean Median Std Dev Kurtosis Statistics MOTHER'S HIGHEST YEAR SCHOOL COMPLETED 2288 249.5 11.56 12.00 4.07 1.27


Q: SAT scores have a mean of 1026 and a standard deviation of 209. ACT scores have a mean of 20.8 and a…
A: The SAT scores, mean, and standard deviation are:The ACT scores, mean, and standard deviation are:
Q: 70% 60% 50% 40% 30% 20% 23.43 10% 64.80 11.71 Store 1 Sales Breakdown by Product Group 53.40 34.29…
A: It is given that the total sales value is 137,000,000. The objective is to determine the percentage…
Q: Because of different sales ability, experience, and devotion, the incomes of real estate agents vary…
A: The Z - test will be used when the population standard deviation is known and sample size is 30.…
Q: Express the confidence interval 32.9% ±4.6% in the form of a trilinear inequality. % Next Question
A: The confidence interval is a) For expressing the confidence interval 25.9% ± 6.4% in form of a…
Q: A social scientist is comparing sample data regarding the number of cars owned per household in a…
A: The objective of the question is to identify the most appropriate statistical test to compare the…
Q: Match each scatterplot shown below with the best desciption of its correlation. O .: o O 1000 . o 0…
A: There are scatterplots provided.Each of the scatterplots must be matched with the best description…
Q: Q2. Classify each variable as discrete or continuous a) Ages of people working in a large factory b)…
A: Definitions:Discrete Variable: A discrete variables are countable and finite that means we can count…
Q: Two hundred observations of a mean zero AR(2)(2) model produced the following sample variance and…
A: The sample variance and sample ACFs produced by observations of a mean model.The method of moment…
Q: You are conducting a study to see if the proportion of voters who prefer Candidate A is…
A: Answer Given,The population proportion, p = 0.2Favorable success [x] = 95Dample size [n] = 390
Q: Source Factor Block Error Total DF ? 3 ? 15 SS 193.800 464.218 ? 698.190 MS 64.600 154.739 4.464 ? ?
A: The total degrees of freedom is and the block degrees of freedom is, .
Q: Q5. The following table shows the number of hours 40 hospital patients slept following the…
A: We have given the following frequency distribution tableClass invervalsFrequency5 - 9310 - 14815 -…
Q: How many factors (i.e., independent variables) are there in a 2 x 3 x 4 x 4 factorial designa 02 0 3…
A: The objective of the question is to determine the number of factors or independent variables in a…
Q: card is drawn from a standard deck of 52 playing cards. Find the probability that the card is an ace…
A: Total cards (T)= 52Heart cards (H)= 13Ace cards (A)= 4Heart and Ace cards (H and A)= 1
Q: A machine produces items to stock according to the following base-stock policy: a production run is…
A: As per the base-stock policy, when the no. of items on stock drops below level the production…
Q: 5. A survey of 500 3-child families was conducted to answer the question "Are boys and girls equally…
A: Given information:k =4 categoriesn= 500 sample size
Q: a. Use a 95% confidence interval to estimate the difference between the population means (₁-H2).…
A: Given,to compare the means of two populations, independent random samples of observations are…
Q: How many factors (i.e., independent variables) are there in a 2 x 3 x 4 x 4 factorial design 02 0 3…
A: The design is a 2 x 3 x 4 x 4 factorial design
Q: In a recent Super Bowl, a TV network predicted that 63 % of the audience would express an interest…
A: From the provided information,
Q: The owner of a small brewery is using Winters method to forecast his quarterly beer sales. He has…
A: The Winter method is used for forecasting quarterly beer sales in a small brewery.The smoothing…
Q: The main height of women in a country ages 20 to 29 is normally distributed with a mean of 64.8…
A: Height of women in a country ages 20 to 29 is normally distributed withMean ()=64.8standard…
Q: I Because of different sales ability, experience, and devotion, the incomes of real estate agents…
A: test the expert's claim about the mean annual income of all real estate agents in the city, we can…
Q: Forest Fires and Acres Burned An environmentalist wants to determine the relationships between the…
A: The objective of the question is to determine the relationship between the number of forest fires…
Q: State the hypotheses. Ho: P ? Ha: P ? Calculate the test statistic. Round to four decimal places. p=…
A: Let p be the population proportion of complaints for identity theft.Given that,Population proportion…
Q: Q7) In the following seven problems, use the given information to find the p-value 24. Claim: μ 84…
A: The provided information is as follows:The objective of the given question is to find p-values.
Q: A When calculating the difference of proportions, the values of -1 and 1 are the V possible…
A: Given:When calculating the difference of proportions, the values of -1 and 1 are the possible…
Q: make an X and R chart to find UCL, and LCL for the X and R chart. is the process in control?
A: The data is given asSampleObservations13.053.083.0723.133.073.0533.063.043.12To find: The upper…
Q: An adventure company runs two obstacle courses, Fundash and Coolsprint. The designer of the courses…
A: Given that an adventure company runs two obstacle courses, Fundash and Coolsprint.For Fundash:,,…
Q: Suppose we observe X Bin(n, p) where n is known by design and p = (0, 1) is the parameter of…
A: where n is known by design and is the parameter of interest.
Q: (a) For a given data, suppose a null hypothesis Ho is rejected at significance level a = 1%. True or…
A: a) For a given data, suppose a null hypothesis H0 is rejected at significance level α = 1%.b)…
Q: A manager wishes to determine the relationship between the number of miles (in hundreds of miles)…
A: Given the following table xy2313331078762865156134815511120
Q: The data below are the number of absences and the final grades of 9 randomly selected students from…
A: The data shows the number of absences and the final grades of 9 randomly selected students from a…
Q: Part 1 of 2 Construct a 95% confidence interval for the paint lifetime. Round your answers to at…
A: Let be the population mean paint lifetime.Given that,Sample size Confidence level
Q: A small parking lot has room for four cars. The cars arrive according to a Poisson process with a…
A: “Since you have posted multiple questions, we will provide the solution only to the first question…
Q: The estimated regression equation for a model involving two independent variables and 10…
A: The objective of the question is to interpret the coefficients of the regression equation and to…
Q: GPAs at CCSU are normally distributed with a mean of 2.32 and a standard deviation of 0.6. Find the…
A: The objective of this question is to calculate the z-score for a GPA of 3.32. The z-score is a…
Q: 1. Data for the Per Capita Energy Consumption and Per Capita GNP output for eight different…
A: The given data is as follows: Country #Per Capita GNP, XPer Capita Energy Consumption,…
Q: Using the weights (lb) and highway fuel consumption amounts (mi/gal) of the 48 cars listed in the…
A: The regression equation is y^=58.9−0.00749∗xwhere,"x" represents weight
Q: Knock-out mice were assessed for maze performance (number of wrong turns) after having surgery to…
A: Given:Knock-out mice were assessed for maze performance (number of wrong turns) after genetic…
Q: Q3. Identify the sampling technique used in the study. (a) In a large school district, all teachers…
A: The objective is to identify the sampling technique used for each of the given scenarios.
Q: Out of 300 people sampled, 258 had kids. Based on this, construct a 99% confidence interval for the…
A:
Q: Find the center line and control limits for each of Find the center line and control limits for…
A: In this problem, the task is to determine the center line and control limits for various control…
Q: The estimated regression equation for a model involving two independent variables and 10…
A: Sample size is Regression equation is
Q: lab, the psychologist records physiological measures of anxiety (heart rate, skin resistance, blood…
A: The data on anxiety rating(X) and exam score (Y) of 6 students are given below,StudentsAnxiety…
Q: b. In 2018, a sample of 300 in-store shoppers showed that 44 paid by debit card. The results shown…
A: The given data is as follows: YearShoppers SurveyedShoppers Paying by Debit Card201830044201940072
Q: One of the formulas for computing / is Σ(x-x)(y-y) (n-1)(s) (s) For the given data, determine the…
A: xy17516218514120810310080169118
Q: 3. Let Y₁, Y2, Y3, Y₁ ~ N(B0, 0²), where Y's are independent. Given the vector Y = [Y₁, Y2, Y3, Y4]…
A: In this problem, we are given a vector Y composed of four independent normal random variables, and…
Q: An experiment was conducted using a randomized block design. The data from the experiment are…
A: Given the data asTreatmentBlock123135624283238
Q: 9. A report stated that 22% of people agree that aliens exist. You conduct your own SRS study, and…
A: From the provided information,
Q: How many factors (i.e., independent variables) are there in a 2 x 3 x 4 x 4 factorial designa 02 0 3…
A: The objective of the question is to determine the number of factors or independent variables in a…
Q: a. b. 7.5 7.5 9 7.577.5 6 5 9 7.5 Use your stapplet or a calculator to find the mean and standard…
A: Given that,The data is given on the number of hours of sleep the student got the previous…
1-What these statistics tell you about the kurtosis of the variables:

Unlock instant AI solutions
Tap the button
to generate a solution
Click the button to generate
a solution
- The American Association of Individual Investors (AAII) conducts a weekly survey of its members to measure the percent who are bullish, bearish, and neutral on the stock market for the next six months. For the week ending March 27, 2019, the survey results showed 33.2% bullish, 39.6% neutral, and 27.2% bearish. Assume these results are based on a sample of 300 AAII members.According to the Pew Research Center,on the propotion of the American population who use only a cellular telephone (landline) is 0.37. Jason conducts a survey of one hundred fifty 20 to 24 year olds who live on their own and finds that 73 do not have a landline to their home. Does this provide sufficient evidence to conclude that the proportion of 20 to 24 year olds who live on their own and don't have a landline is greater than 0.37? Use a=0.10 level of significance. A) Verify that nP0(1-P0)>10 and n< 0.05N (Assume the population sizes is N=40 million) B) State the appropiate null and alternative hypotheses. C) Indicate whether the hypothesis is left, right, or two- tailed.According to the Pew Research Center,on the propotion of the American population who use only a cellular telephone (landline) is 0.37. Jason conducts a survey of one hundred fifty 20 to 24 year olds who live on their own and finds that 73 do not have a landline to their home. Does this provide sufficient evidence to conclude that the proportion of 20 to 24 year olds who live on their own and don't have a landline is greater than 0.37? Use a=0.10 level of significance. D) Compute the test statistic z0. Round to the nearest hundredth. E) Draw a normal model with the area that represents the P-value shaded. F) Determine and interpret the P-value. What is the conclusion of the hypothesis test?
- According to the Department of Motor Vehicles (DMV), the entity in charge ofprovidingdrivinglicensesintheUnitedStates,itisillegaltodrivewithabloodalcoholcontentof0.08%ormoreif you are 21 or older. In the DMV’s guidelines to determine when a person is driving under the influence, itisindicatedthatfewer than five percent of the population weighing 100 pounds will exceed the 0.33 alcohol level. Assume this is accurate. If the Highway Patrol stops in a random day 200 unrelated cars where the individual weighs one hundred pounds, on a Friday night, what is the probability that six percent of more individuals stopped exceeds that 0.33 alcohol level?The director of the MBA program at Salterdine University wants to develop a procedure to determine which applicants to admit to the MBA program. The director believes that an applicant’s undergraduate grade point average (GPA) and score on the GMAT exam are helpful in predicting which applicants will be good students. To assist in this endeavor, the director asked a committee of faculty members to classify 70 of the recent students in the MBA program into two groups: (1) good students and (2) weak students. The file MBAStudents.xlsm summarizes these ratings, along with the GPA and GMAT scores for the 70 students. What are the coordinates of the centroids for the good students and the weak students? Use XLMiner’s standard data partition command to partition the data into a training set (with 60% of the observations) and validation set (with 40% of the observations) using the default seed of 12345. Use discriminant analysis to create a classifier for this data. How accurate is this…Calculate the point prevalence for Alzheimer’s disease among individuals 65 years of age or older in a county that has 200,000 individuals who are 65 years of age or older, if 22,223 individuals who are 65 years of age or older have the disease. 0.0111 0.1111 0.8889 0.9889
- The Institute of Education Sciences measures the high school dropout rate as the percentageof 16-through 24-year-olds who are not enrolled in school and have not earned a high schoolcredential. Last year, the high school dropout rate was 8.1%. A polling company recently took asurvey of 1,000 people between the ages of 16 and 24 and found that 6.5% of them are highschool dropouts. The polling company would like to determine whether the dropout rate hasdecreased at a 5% significance levelis there is a main effect of disposition, would Tuckey's HSD need to be calculatedA lawyer received a complaint from a factory workers somewhere in Pampanga. The workers claimed that the were being forced to work for more than 8 hours. 8 hours is the average/normal work time per day in the Philippines as stated in the Labor Code and was initially stipulated by their employer when they were hired. They also reported that they were not receiving any compensation for their overtime work. The lawyer commissioned you to conduct a survey involving 10 randomly selected workers from the factory to inquire about their work time. The data you collected is displayed below. 8 hours 6 hours 5 hours 10 hours 14 hours 3 hours 9 hours 8 hours 11 hours 14 hours Use the P-Value Approach in testing the complaint of the workers. a. Estimate μ at 99% confidence interval. b. Did you find support for the rep’s claim? Why/not? c. Based on your findings, would you advice the lawyer to take the case? Why/not? d. If you drew the wrong conclusion and gave the labor lawyer the wrong…
- If the probablitiy of being hit by lightning is 1/100,000, what is the probablitiy of not getting hit by lightning?the u.S. bureau of labor Statistics reports that 11.3% of u.S. workers belong to unions(blS website, January 2014). Suppose a sample of 400 u.S. workers is collected in 2014to determine whether union efforts to organize have increased union membership.a. formulate the hypotheses that can be used to determine whether union membershipincreased in 2014.The following data is given for Soweto Hospital with regards to the number of patients admitted in the first half of the year ended 30 June 2023 and the total costs incurred by the hospital to treat these patients in this period:MonthNumber of patients admittedTotal costs incurred by the hospital (Rands)January20050 000February20050 000March25055 000April25055 000May30060 000June15045 000Required:Calculate the variable cost per unit and total fixed costs by using the Least Squares (Simple Regression Analysis) method.


