Nana AB. supplies a range of computer hardware and software to 2000 schools within a large municipal region of Spain. When Nana AB. won the contract the issue of customer service was considered to be central to the company being successful at the final bidding stage. The company has now requested that its customer service director creates a series of graphical representations of the data to illustrate customer satisfaction with the service. The following data has been collected during the last six months and measures the time to respond to the received complaint (days). 5 24 34 6 61 56 38 32 87 78 34 9 67 4 54 23 56 32 86 12 81 32 52 53 34 45 21 31 42 12 53 21 43 76 62 12 73 3 67 12 78 89 26 10 74 78 23 32 26 21 56 78 91 85 15 12 15 56 45 21 45 26 21 34 28 12 67 23 24 43 25 65 23 8 87 21 78 54 76 79 The customer service director has analysed this data to create a grouped frequency table and plotted the histogram. From this he made a series of observations regarding the time to respond to customer complaints. He now wishes to extend the analysis to use numerical methods to describe this data. (a) From the data set calculate the mean and median. (b) Repeat the analysis to calculate the standard deviation, quartiles (Q1, Q2, and Q3), quartile range, and semi interquartile range. (c) What conclusions can you draw from these results?


Contingency Table
A contingency table can be defined as the visual representation of the relationship between two or more categorical variables that can be evaluated and registered. It is a categorical version of the scatterplot, which is used to investigate the linear relationship between two variables. A contingency table is indeed a type of frequency distribution table that displays two variables at the same time.
Binomial Distribution
Binomial is an algebraic expression of the sum or the difference of two terms. Before knowing about binomial distribution, we must know about the binomial theorem.
Nana AB. supplies a
5
24
34
6
61
56
38
32
87
78
34
9
67
4
54
23
56
32
86
12
81
32
52
53
34
45
21
31
42
12
53
21
43
76
62
12
73
3
67
12
78
89
26
10
74
78
23
32
26
21
56
78
91
85
15
12
15
56
45
21
45
26
21
34
28
12
67
23
24
43
25
65
23
8
87
21
78
54
76
79
The customer service director has analysed this data to create a grouped frequency table and plotted the histogram. From this he made a series of observations regarding the time to respond to customer complaints. He now wishes to extend the analysis to use numerical methods to describe this data.
(a) From the data set calculate the mean and median.
(b) Repeat the analysis to calculate the standard deviation,
Q3), quartile range, and semi
(c) What conclusions can you draw from these results?
(a)
The mean time to respond to the customer complaints is,
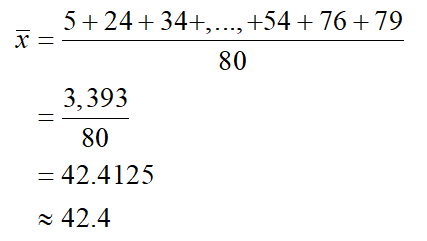
Thus ,the mean time to respond to the customer complaints is 42.4 days.
The median is the average of the middle two values of the sorted data.
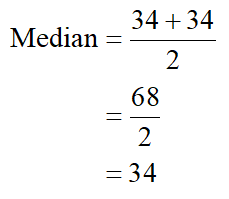
Thus, the median time to respond to the customer complaints is 34 days.
(b)
The standard deviation, quartiles, quartile range and the semi-interquartile range are,
Standard deviation:
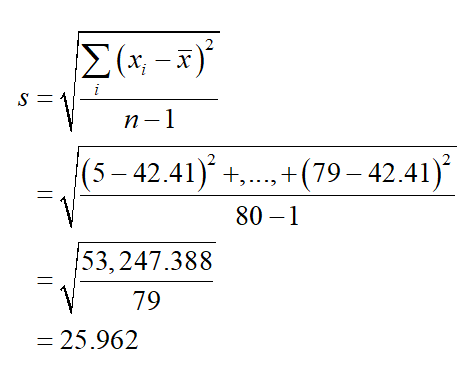
Thus ,the standard deviation for the time to respond to the customer complaints is 25.692 days.
First-quartile:
It is the average value of the data points that lies to the left of the median since the number data points that lie to the left of the median.
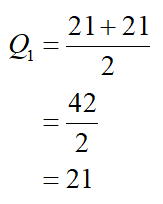
Thus ,Q1 is 21 days.
Third-quartile:
It is the median value of the data points that lies to the right of the median since the number data points that lie to the right of the median is 67.
Thus, Q3 is 67.
Inter-quartile range:
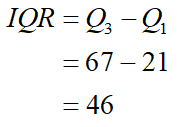
Thus, the inter-quartile range is 46.
Semi-interquartile range:
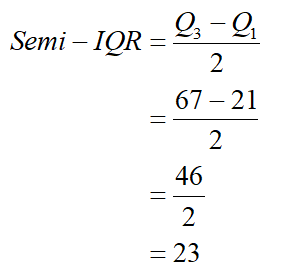
Thus, the semi-interquartile range is 23 days.

Step by step
Solved in 3 steps with 8 images


