narrow slits, and a screen are arranged as shown in the top-view a. In the space above the diagram at right, clearly label each of Point R marks a minimum to the right of point Q. The diagram at right shows the pattern that appears on a distant screen. Point P, the center of the pattern, and point Q are maxima. diagram below right. Q R the lettered points according to AD, the difference in distances Grom the slits to that point. Express each value of AD in terms of A. Center of screen b. The screen is 2.2 m from the slits, and the distance from point P to point R is 1.6 mm. Top view (not to scale) Determine the distance between the slits in terms of 2. Show your work and describe any approximations that you make in answering this question. Screen Mask with 2 slits To distant point source
narrow slits, and a screen are arranged as shown in the top-view a. In the space above the diagram at right, clearly label each of Point R marks a minimum to the right of point Q. The diagram at right shows the pattern that appears on a distant screen. Point P, the center of the pattern, and point Q are maxima. diagram below right. Q R the lettered points according to AD, the difference in distances Grom the slits to that point. Express each value of AD in terms of A. Center of screen b. The screen is 2.2 m from the slits, and the distance from point P to point R is 1.6 mm. Top view (not to scale) Determine the distance between the slits in terms of 2. Show your work and describe any approximations that you make in answering this question. Screen Mask with 2 slits To distant point source

University Physics Volume 3
17th Edition
ISBN:9781938168185
Author:William Moebs, Jeff Sanny
Publisher:William Moebs, Jeff Sanny
Chapter4: Diffraction
Section: Chapter Questions
Problem 8CQ: Shown below is the central part of the interference pattern for a pure wavelength of red light...

Related questions
Question
A and b please
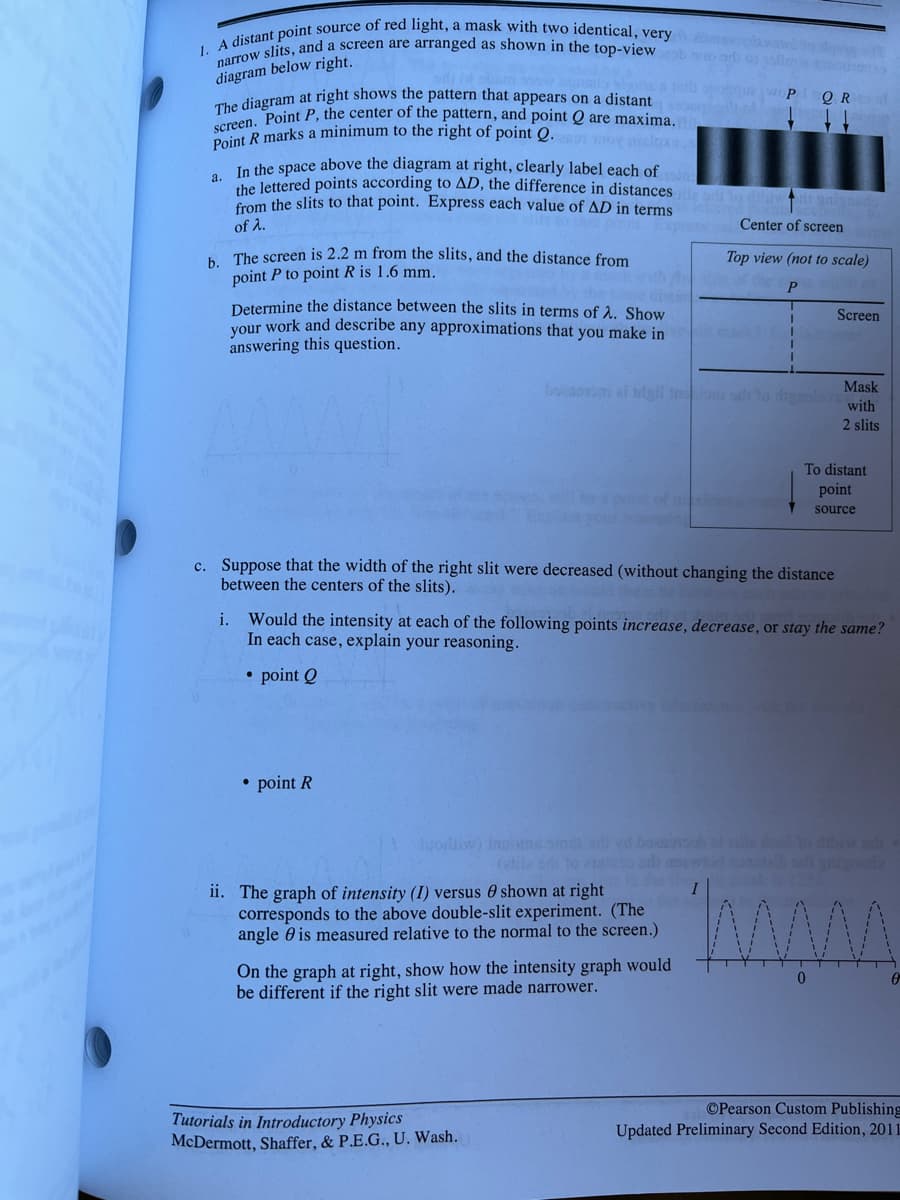
Transcribed Image Text:narrow slits, and a screen are arranged as shown in the top-view
The diagram at right shows the pattern that appears on a distant
Point R marks a minimum to the right of point Q.
screen. Point P, the center of the pattern, and point Q are maxima.
llm
diagram below right.
WPQR
In the space above the diagram at right, clearly label each of
the lettered points according to AD, the difference in distances
from the slits to that point. Express each value of AD in terms
a.
of 2.
Center of screen
h. The screen is 2.2 m from the slits, and the distance from
point P to point R is 1.6 mm.
Determine the distance between the slits in terms of A. Show
vour work and describe any approximations that you make in
answering this question.
Top view (not to scale)
Screen
boaorom ai igil ni od o dignale
Mask
with
2 slits
To distant
point
source
our onin
c. Suppose that the width of the right slit were decreased (without changing the distance
between the centers of the slits).
i. Would the intensity at each of the following points increase, decrease, or stay the same?
In each case, explain your reasoning.
• point Q
• point R
Juordiw) Insomna sm or yd bouob alll to ibi
ii. The graph of intensity (I) versus 0 shown at right
corresponds to the above double-slit experiment. (The
angle 0 is measured relative to the normal to the screen.)
On the graph at right, show how the intensity graph would
be different if the right slit were made narrower.
©Pearson Custom Publishing
Tutorials in Introductory Physics
McDermott, Shaffer, & P.E.G., U. Wash.
Updated Preliminary Second Edition, 2011
Expert Solution
This question has been solved!
Explore an expertly crafted, step-by-step solution for a thorough understanding of key concepts.

This is a popular solution!

Trending now
This is a popular solution!

Step by step
Solved in 2 steps with 2 images

Knowledge Booster


Learn more about
Need a deep-dive on the concept behind this application? Look no further. Learn more about this topic, physics and related others by exploring similar questions and additional content below.Recommended textbooks for you
University Physics Volume 3
Physics
ISBN:
9781938168185
Author:
William Moebs, Jeff Sanny
Publisher:
OpenStax

Glencoe Physics: Principles and Problems, Student…
Physics
ISBN:
9780078807213
Author:
Paul W. Zitzewitz
Publisher:
Glencoe/McGraw-Hill
University Physics Volume 3
Physics
ISBN:
9781938168185
Author:
William Moebs, Jeff Sanny
Publisher:
OpenStax
Glencoe Physics: Principles and Problems, Student…
Physics
ISBN:
9780078807213
Author:
Paul W. Zitzewitz
Publisher:
Glencoe/McGraw-Hill