Suppose the true regression model is Y, B₁ + B₂ X₁ + and it happens that that variance of, of disturbance term for the ith observation is proportional to the value of X₁. To improve the efficiency of the estimation, we define a new variable 2. and obtain a fitted weighted least squares regression: 2=5+0.2+ Fill in the following blanks: 1. The weighted least squares estimator for B₁ is 2. The weighted least squares estimator for B₂ is
Suppose the true regression model is Y, B₁ + B₂ X₁ + and it happens that that variance of, of disturbance term for the ith observation is proportional to the value of X₁. To improve the efficiency of the estimation, we define a new variable 2. and obtain a fitted weighted least squares regression: 2=5+0.2+ Fill in the following blanks: 1. The weighted least squares estimator for B₁ is 2. The weighted least squares estimator for B₂ is

Linear Algebra: A Modern Introduction
4th Edition
ISBN:9781285463247
Author:David Poole
Publisher:David Poole
Chapter7: Distance And Approximation
Section7.3: Least Squares Approximation
Problem 31EQ

Related questions
Question
1.
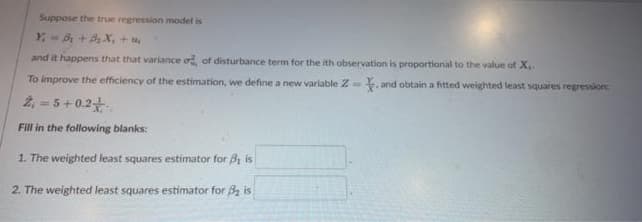
Transcribed Image Text:Suppose the true regression model is
Y-B₁ + B₂X₁ +
and it happens that that variance of, of disturbance term for the ith observation is proportional to the value of X..
To improve the efficiency of the estimation, we define a new variable 2. and obtain a fitted weighted least squares regression:
2₁ = 5 +0.2
Fill in the following blanks:
1. The weighted least squares estimator for B₁ is
2. The weighted least squares estimator for ₂ is
Expert Solution
This question has been solved!
Explore an expertly crafted, step-by-step solution for a thorough understanding of key concepts.

Step by step
Solved in 2 steps

Recommended textbooks for you
Linear Algebra: A Modern Introduction
Algebra
ISBN:
9781285463247
Author:
David Poole
Publisher:
Cengage Learning

College Algebra
Algebra
ISBN:
9781305115545
Author:
James Stewart, Lothar Redlin, Saleem Watson
Publisher:
Cengage Learning

Glencoe Algebra 1, Student Edition, 9780079039897…
Algebra
ISBN:
9780079039897
Author:
Carter
Publisher:
McGraw Hill
Linear Algebra: A Modern Introduction
Algebra
ISBN:
9781285463247
Author:
David Poole
Publisher:
Cengage Learning
College Algebra
Algebra
ISBN:
9781305115545
Author:
James Stewart, Lothar Redlin, Saleem Watson
Publisher:
Cengage Learning
Glencoe Algebra 1, Student Edition, 9780079039897…
Algebra
ISBN:
9780079039897
Author:
Carter
Publisher:
McGraw Hill