ne regression output is provided below with corresponding standard errors in parentheses. ids = -7.731 +0.19y74-0.09y76-0.06y78-0.08y80 - 0.42y82 -0.65y84 -0.135educ +0.277age - 0.0osSage? +0.88black (0.175) (3.101) t0.171) (0.171) (0.182) (0.188) (0.173) (0.20) (0.111) (0.001) (0.177) -0.114 siven the below critical values fill in the blanks. Round to two decimals if necessary Significance level Critical value 1% 2.58 5% 1.96 10% 164 he coefficient of y74 is This implies, holding education, age and race constant, 100 women in 1974 are predicted to have children compared to 100 women in 1972. (Hint: For the second blank of this sentence make a choice be
ne regression output is provided below with corresponding standard errors in parentheses. ids = -7.731 +0.19y74-0.09y76-0.06y78-0.08y80 - 0.42y82 -0.65y84 -0.135educ +0.277age - 0.0osSage? +0.88black (0.175) (3.101) t0.171) (0.171) (0.182) (0.188) (0.173) (0.20) (0.111) (0.001) (0.177) -0.114 siven the below critical values fill in the blanks. Round to two decimals if necessary Significance level Critical value 1% 2.58 5% 1.96 10% 164 he coefficient of y74 is This implies, holding education, age and race constant, 100 women in 1974 are predicted to have children compared to 100 women in 1972. (Hint: For the second blank of this sentence make a choice be

Glencoe Algebra 1, Student Edition, 9780079039897, 0079039898, 2018
18th Edition
ISBN:9780079039897
Author:Carter
Publisher:Carter
Chapter10: Statistics
Section10.1: Measures Of Center
Problem 9PPS

Related questions
Question
5
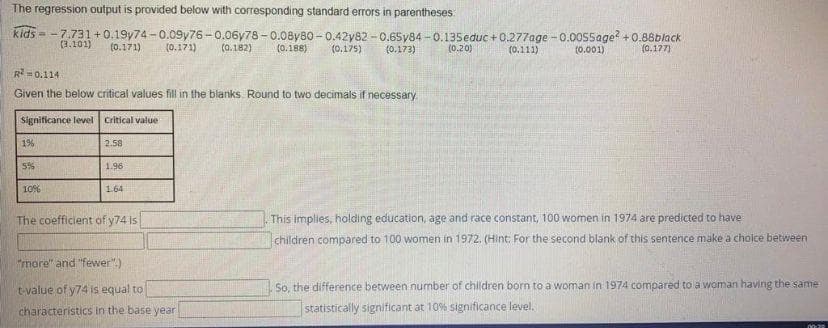
Transcribed Image Text:The regression output is provided below with corresponding standard errors in parentheses
kids = -7.731 +0.19y74 -0.09y76-0.06y78 -0.08y80 - 0.42y82 -0.65y84 -0.135educ + 0.277age - 0.0055age? +0.88black
(0.175)
(3.101)
(0.171)
(0.171)
(0.182)
(0.188)
(0.173)
(0.20)
(0.111)
(0.001)
(0.177)
R = 0.114
Given the below critical values fill in the blanks Round to two decimals if necessary
Significance level Critical value
1%
2.58
1.96
10%
1.64
The coefficient of y74 is
This implies, holding education, age and race constant, 100 women in 1974 are predicted to have
children compared to 100 women in 1972. (Hint: For the second blank of this sentence make a choice between
"more" and "fewer")
tvalue of y74 is equal to
So, the difference between number of children born to a woman in 1974 compared to a woman having the same
characteristics in the base year
statistically significant at 10% significance level.
Expert Solution
This question has been solved!
Explore an expertly crafted, step-by-step solution for a thorough understanding of key concepts.

This is a popular solution!

Trending now
This is a popular solution!

Step by step
Solved in 2 steps

Recommended textbooks for you
Glencoe Algebra 1, Student Edition, 9780079039897…
Algebra
ISBN:
9780079039897
Author:
Carter
Publisher:
McGraw Hill
Glencoe Algebra 1, Student Edition, 9780079039897…
Algebra
ISBN:
9780079039897
Author:
Carter
Publisher:
McGraw Hill