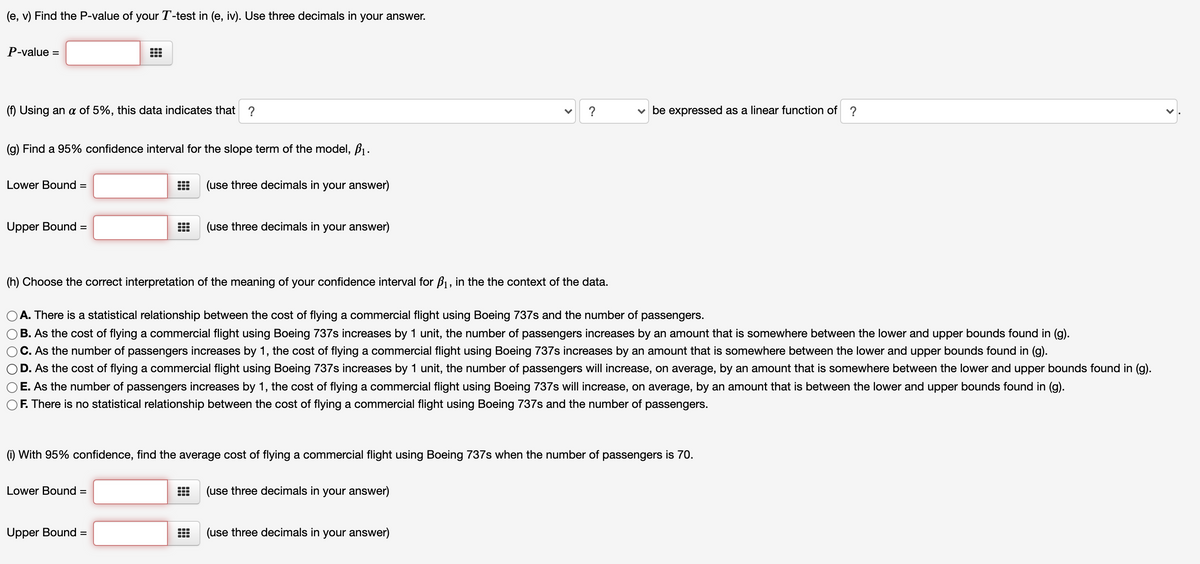
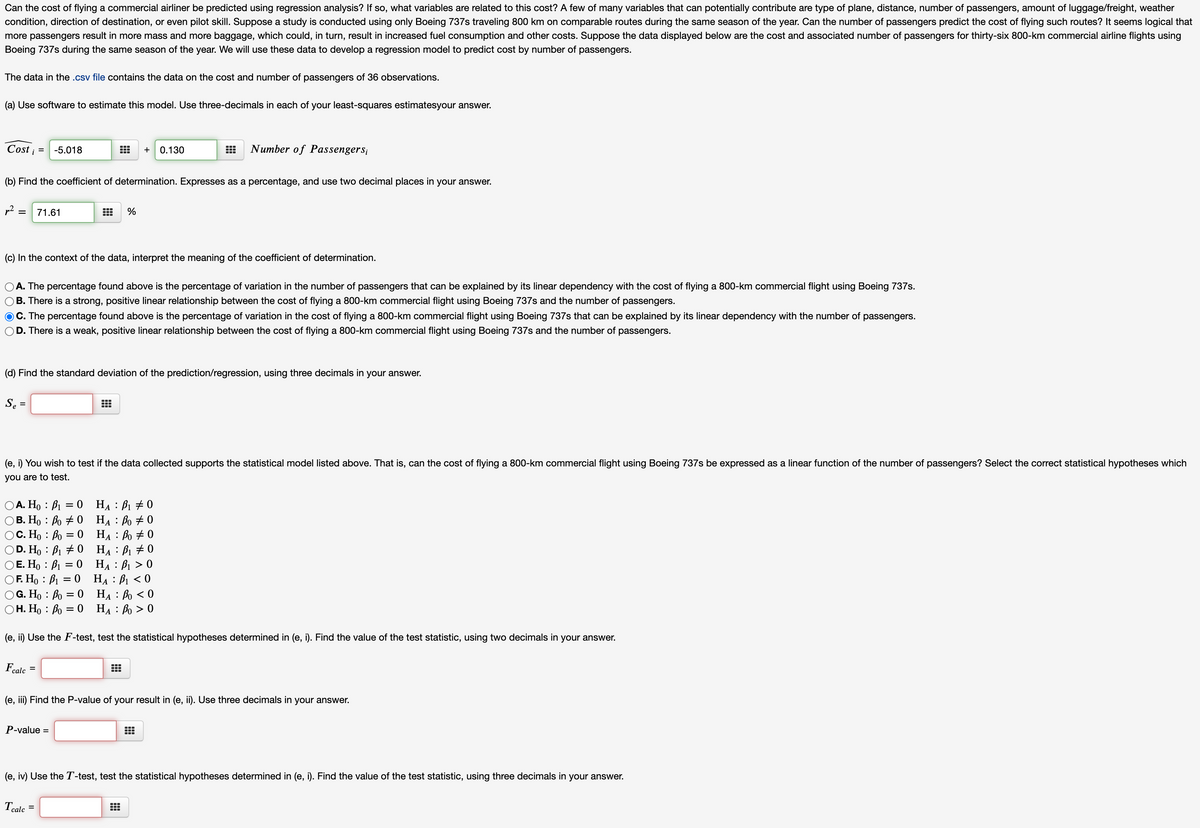
Need help with part d-i. Thank you! The following is the data:


Inverse Normal Distribution
The method used for finding the corresponding z-critical value in a normal distribution using the known probability is said to be an inverse normal distribution. The inverse normal distribution is a continuous probability distribution with a family of two parameters.
Mean, Median, Mode
It is a descriptive summary of a data set. It can be defined by using some of the measures. The central tendencies do not provide information regarding individual data from the dataset. However, they give a summary of the data set. The central tendency or measure of central tendency is a central or typical value for a probability distribution.
Z-Scores
A z-score is a unit of measurement used in statistics to describe the position of a raw score in terms of its distance from the mean, measured with reference to standard deviation from the mean. Z-scores are useful in statistics because they allow comparison between two scores that belong to different normal distributions.
Need help with part d-i. Thank you! The following is the data:
|
|
Cost |
Passengers |
|
1 |
3.7 |
63 |
|
2 |
6.01 |
86 |
|
3 |
4.16 |
73 |
|
4 |
5.7 |
80 |
|
5 |
5.78 |
91 |
|
6 |
5.1 |
68 |
|
7 |
5.01 |
69 |
|
8 |
4.39 |
72 |
|
9 |
5.57 |
83 |
|
10 |
5.03 |
79 |
|
11 |
1.24 |
51 |
|
12 |
6.89 |
96 |
|
13 |
6.91 |
85 |
|
14 |
2.03 |
48 |
|
15 |
2.12 |
64 |
|
16 |
8.72 |
110 |
|
17 |
5.1 |
76 |
|
18 |
0.54 |
59 |
|
19 |
8.15 |
91 |
|
20 |
3.08 |
71 |
|
21 |
4.39 |
65 |
|
22 |
4.67 |
78 |
|
23 |
6.29 |
96 |
|
24 |
4.7 |
70 |
|
25 |
4.55 |
84 |
|
26 |
3.96 |
63 |
|
27 |
7.66 |
83 |
|
28 |
4.25 |
77 |
|
29 |
4.55 |
74 |
|
30 |
3.09 |
75 |
|
31 |
7.66 |
94 |
|
32 |
9.31 |
86 |
|
33 |
6.25 |
84 |
|
34 |
3.05 |
65 |
|
35 |
6.42 |
83 |
|
36 |
4.02 |
78 |

Step by step
Solved in 2 steps with 1 images


