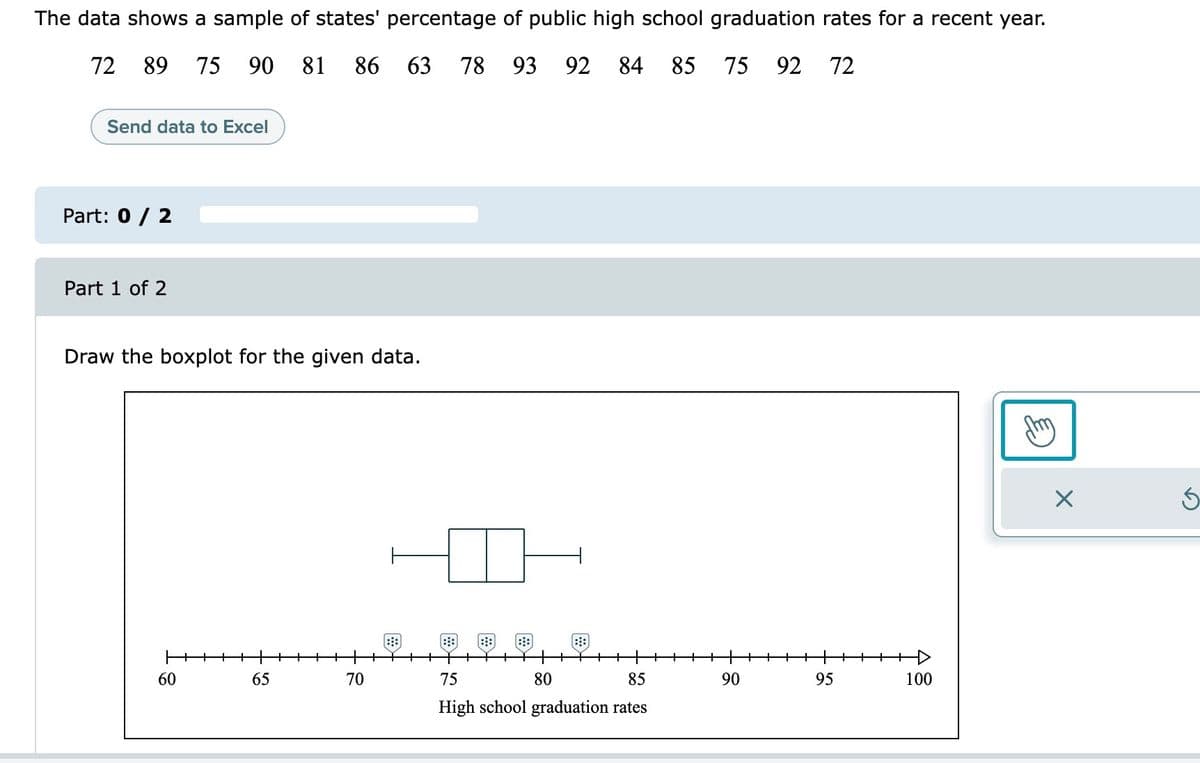
The data shows a sample of states' percentage of public high school graduation rates for a recent year. 72 89 75 90 81 86 63 78 93 92 84 85 75 92 72 Send data to Excel Part: 0 / 2 Part 1 of 2 Draw the boxplot for the given data. 60 65 70 75 80 85 90 95 100 High school graduation rates
The data shows a sample of states' percentage of public high school graduation rates for a recent year. 72 89 75 90 81 86 63 78 93 92 84 85 75 92 72 Send data to Excel Part: 0 / 2 Part 1 of 2 Draw the boxplot for the given data. 60 65 70 75 80 85 90 95 100 High school graduation rates

Algebra & Trigonometry with Analytic Geometry
13th Edition
ISBN:9781133382119
Author:Swokowski
Publisher:Swokowski
Chapter4: Polynomial And Rational Functions
Section4.3: Zeros Of Polynomials
Problem 55E

Related questions
Question
Transcribed Image Text:The data shows a sample of states' percentage of public high school graduation rates for a recent year.
72 89
75 90
81
86 63
78 93
92 84 85
75 92
72
Send data to Excel
Part: 0 / 2
Part 1 of 2
Draw the boxplot for the given data.
::
:::
60
65
70
75
80
85
90
95
100
High school graduation rates
Expert Solution
This question has been solved!
Explore an expertly crafted, step-by-step solution for a thorough understanding of key concepts.

This is a popular solution!

Trending now
This is a popular solution!

Step by step
Solved in 3 steps with 1 images

Recommended textbooks for you
Algebra & Trigonometry with Analytic Geometry
Algebra
ISBN:
9781133382119
Author:
Swokowski
Publisher:
Cengage

Functions and Change: A Modeling Approach to Coll…
Algebra
ISBN:
9781337111348
Author:
Bruce Crauder, Benny Evans, Alan Noell
Publisher:
Cengage Learning
Algebra & Trigonometry with Analytic Geometry
Algebra
ISBN:
9781133382119
Author:
Swokowski
Publisher:
Cengage
Functions and Change: A Modeling Approach to Coll…
Algebra
ISBN:
9781337111348
Author:
Bruce Crauder, Benny Evans, Alan Noell
Publisher:
Cengage Learning