Need the H0 and H1 values

Glencoe Algebra 1, Student Edition, 9780079039897, 0079039898, 2018
18th Edition
ISBN:9780079039897
Author:Carter
Publisher:Carter
Chapter10: Statistics
Section10.5: Comparing Sets Of Data
Problem 13PPS

Related questions

Concept explainers
Equations and Inequations
Equations and inequalities describe the relationship between two mathematical expressions.
Linear Functions
A linear function can just be a constant, or it can be the constant multiplied with the variable like x or y. If the variables are of the form, x2, x1/2 or y2 it is not linear. The exponent over the variables should always be 1.
Question
Need the H0 and H1 values. Can use != for not equal to.
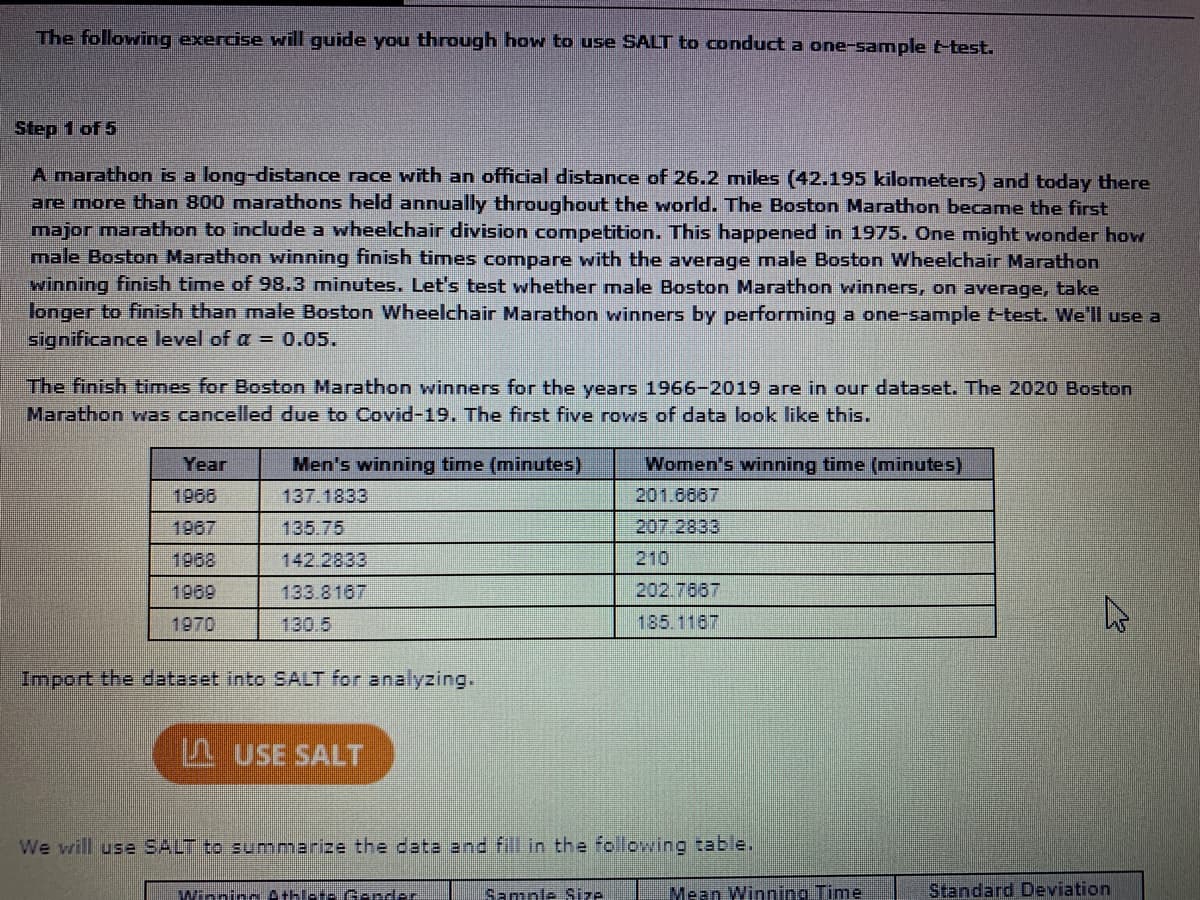
Transcribed Image Text:The following exercise will guide you through how to use SALT to conduct a one-sample t-test.
Step 1 of 5
A marathon is a long-distance race with an official distance of 26.2 miles (42.195 kilometers) and today there
are more than 800 marathons held annually throughout the world. The Boston Marathon became the first
major marathon to include a wheelchair division competition. This happened in 1975. One might wonder how
male Boston Marathon winning finish times compare with the average male Boston Wheelchair Marathon
winning finish time of 98.3 minutes. Let's test whether male Boston Marathon winners, on average, take
longer to finish than male Boston Wheelchair Marathon winners by performing a one-sample t-test. We'll use a
significance level of a = 0.05.
The finish times for Boston Marathon winners for the years 1966-2019 are in our dataset. The 2020 Boston
Marathon was cancelled due to Covid-19. The first five rows of data look like this.
Year
Men's winning time (minutes)
Women's winning time (minutes)
1968
137.1833
201.6667
1967
135.75
207.2833
1968
142.2833
210
1969
133.8167
202.7667
1970
130.5
185.1187
Import the dateset into SALT for analyzing.
P USE SALT
We will use SALT to summarize the data and fill in the following table.
Winning Athlete Gsndar
Sample Size
Mean Winning Time
Standard Deviation
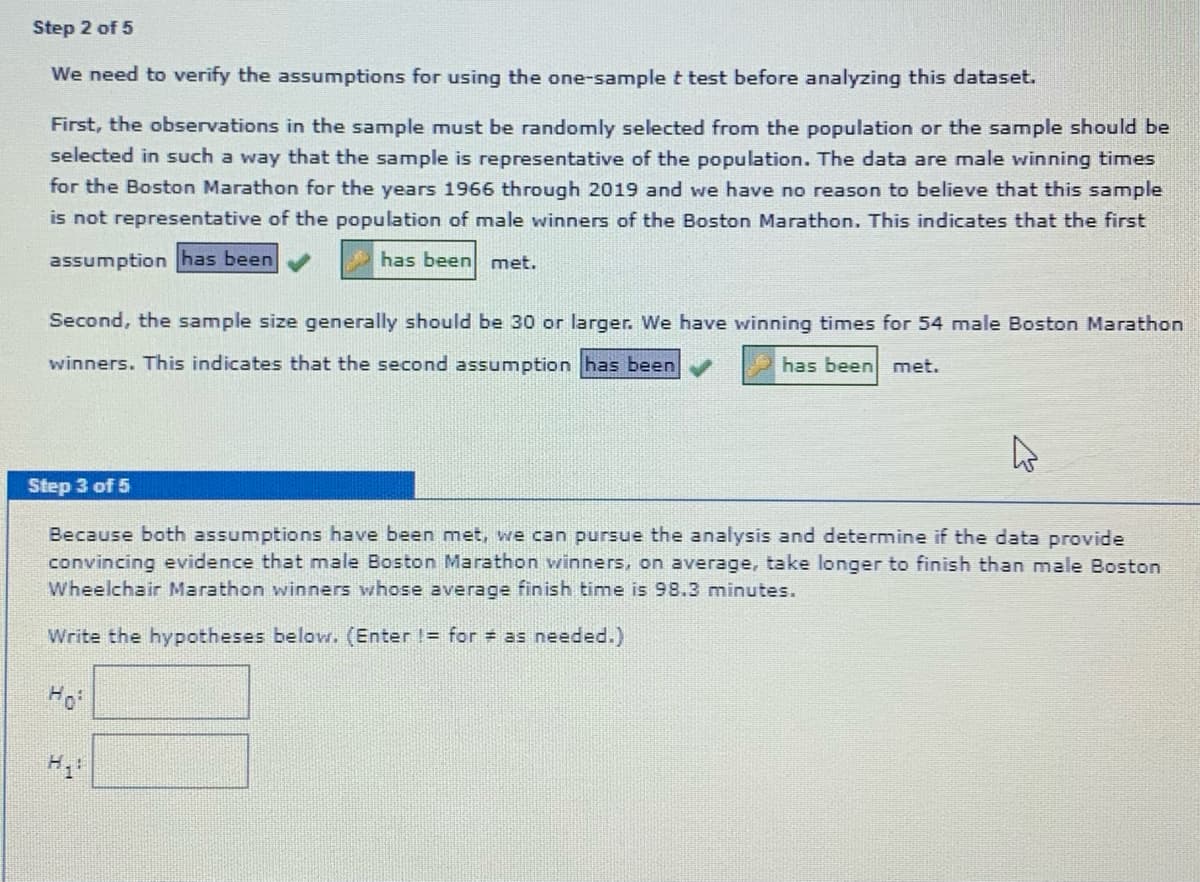
Transcribed Image Text:Step 2 of 5
We need to verify the assumptions for using the one-sample t test before analyzing this dataset.
First, the observations in the sample must be randomly selected from the population or the sample should be
selected in such a way that the sample is representative of the population. The data are male winning times
for the Boston Marathon for the years 1966 through 2019 and we have no reason to believe that this sample
is not representative of the population of male winners of the Boston Marathon. This indicates that the first
assumption has been
has been met.
Second, the sample size generally should be 30 or larger. We have winning times for 54 male Boston Marathon
winners. This indicates that the second assumption has been
has been met.
Step 3 of 5
Because both assumptions have been met, we can pursue the analysis and determine if the data provide
convincing evidence that male Boston Marathon winners, on average, take longer to finish than male Boston
Wheelchair Marathon winners whose average finish time is 98.3 minutes.
Write the hypotheses below. (Enter I= for = as needed.)
Ho
Expert Solution
This question has been solved!
Explore an expertly crafted, step-by-step solution for a thorough understanding of key concepts.

This is a popular solution!

Trending now
This is a popular solution!

Step by step
Solved in 2 steps

Knowledge Booster


Learn more about
Need a deep-dive on the concept behind this application? Look no further. Learn more about this topic, statistics and related others by exploring similar questions and additional content below.Recommended textbooks for you
Glencoe Algebra 1, Student Edition, 9780079039897…
Algebra
ISBN:
9780079039897
Author:
Carter
Publisher:
McGraw Hill

College Algebra (MindTap Course List)
Algebra
ISBN:
9781305652231
Author:
R. David Gustafson, Jeff Hughes
Publisher:
Cengage Learning
Glencoe Algebra 1, Student Edition, 9780079039897…
Algebra
ISBN:
9780079039897
Author:
Carter
Publisher:
McGraw Hill
College Algebra (MindTap Course List)
Algebra
ISBN:
9781305652231
Author:
R. David Gustafson, Jeff Hughes
Publisher:
Cengage Learning