nology to find the P-value und to three decimal places as needed.) whether to reject or fail to reject the null hypothesis following is correct? ct Ho because the P-value is greater than the significance level o reject Ho because the P-value is greater than the significance level. o reject Ho because the P-value is less than the significance level. Ho because the P-value is less than the significance level. the decision in the context of the original claim. 5% level of significance, there is sufficient evidence to support the claim that the mean size for full-time faculty is more than 31 students. 5% level of significance, there is not sufficient evidence to support the claim that the class size for full-time faculty is more than 31 students OB. At the 5% level of significance, there is not sufficient evidence to support the claim that the mean class size for full-time faculty is fewer than 31 students OD. At the 5% level of significance, there is sufficient evidence to support the claim that the mean class size for full-time faculty is fewer than 31 students.
nology to find the P-value und to three decimal places as needed.) whether to reject or fail to reject the null hypothesis following is correct? ct Ho because the P-value is greater than the significance level o reject Ho because the P-value is greater than the significance level. o reject Ho because the P-value is less than the significance level. Ho because the P-value is less than the significance level. the decision in the context of the original claim. 5% level of significance, there is sufficient evidence to support the claim that the mean size for full-time faculty is more than 31 students. 5% level of significance, there is not sufficient evidence to support the claim that the class size for full-time faculty is more than 31 students OB. At the 5% level of significance, there is not sufficient evidence to support the claim that the mean class size for full-time faculty is fewer than 31 students OD. At the 5% level of significance, there is sufficient evidence to support the claim that the mean class size for full-time faculty is fewer than 31 students.

Glencoe Algebra 1, Student Edition, 9780079039897, 0079039898, 2018
18th Edition
ISBN:9780079039897
Author:Carter
Publisher:Carter
Chapter10: Statistics
Section10.5: Comparing Sets Of Data
Problem 14PPS

Related questions
Question
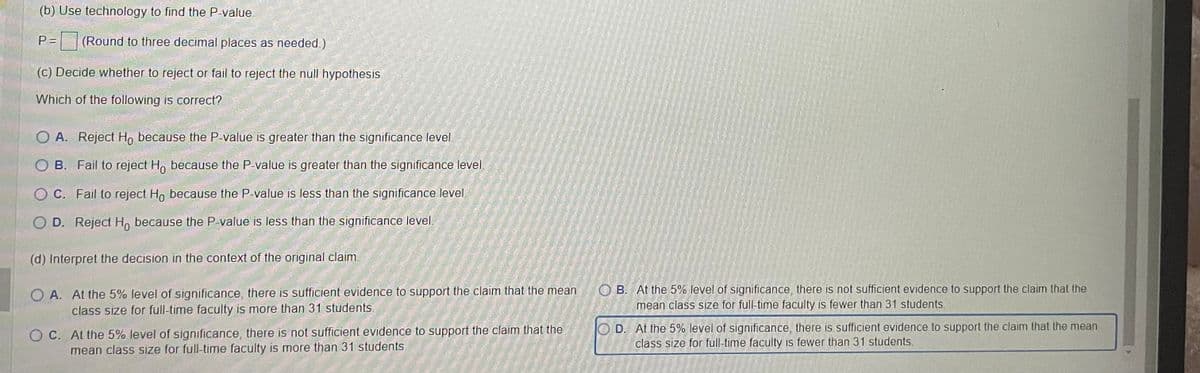
Transcribed Image Text:(b) Use technology to find the P-value
P= (Round to three decimal places as needed.)
(c) Decide whether to reject or fail to reject the null hypothesis.
Which of the following is correct?
O A. Reject Ho because the P-value is greater than the significance level
B. Fail to reject Ho because the P-value is greater than the significance level.
O C. Fail to reject Ho because the P-value is less than the significance level.
OD. Reject Ho because the P-value is less than the significance level.
(d) Interpret the decision in the context of the original claim.
OA. At the 5% level of significance, there is sufficient evidence to support the claim that the mean
class size for full-time faculty is more than 31 students.
OC. At the 5% level of significance, there is not sufficient evidence to support the claim that the
mean class size for full-time faculty is more than 31 students.
OB. At the 5% level of significance, there is not sufficient evidence to support the claim that the
mean class size for full-time faculty is fewer than 31 students.
D. At the 5% level of significance, there is sufficient evidence to support the claim that the mean
class size for full-time faculty is fewer than 31 students.
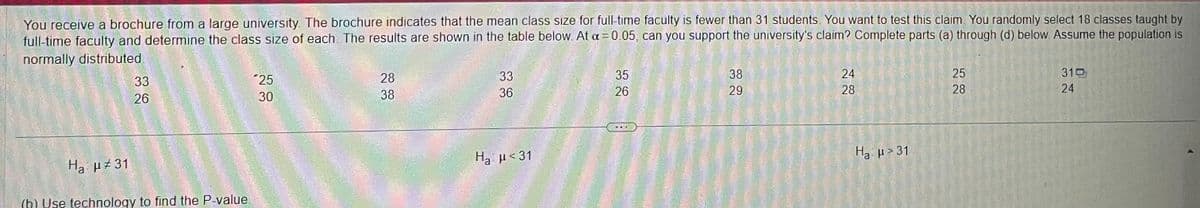
Transcribed Image Text:You receive a brochure from a large university. The brochure indicates that the mean class size for full-time faculty is fewer than 31 students. You want to test this claim. You randomly select 18 classes taught by
full-time faculty and determine the class size of each. The results are shown in the table below. At a = 0.05, can you support the university's claim? Complete parts (a) through (d) below. Assume the population is
normally distributed
Ha μ#31
33
26
(b) Use technology to find the P-value.
25
30
28
38
33
36
H₂ μ<31
35
26
38
29
24
28
Ha μ>31
EN
25
28
310
24
Expert Solution
This question has been solved!
Explore an expertly crafted, step-by-step solution for a thorough understanding of key concepts.

Step by step
Solved in 3 steps with 2 images

Recommended textbooks for you
Glencoe Algebra 1, Student Edition, 9780079039897…
Algebra
ISBN:
9780079039897
Author:
Carter
Publisher:
McGraw Hill
Glencoe Algebra 1, Student Edition, 9780079039897…
Algebra
ISBN:
9780079039897
Author:
Carter
Publisher:
McGraw Hill