Nominal Logistic Fit for PassClass(Words) Logistic Plot 1.00 PassClass(Words) 0.75 0.50- 0.25 0.00 60 65 70 75 80 85 MidtermScore PassClass FailClass Converged in Gradient, 6 iterations Odds Ratios For PassClass(Words) odds of FailClass versus PassClass Unit Odds Ratios Per unit change in regressor Term Odds Ratio Lower 95% Upper 95% Reciprocal MidtermScore 0.695057 0.509788 0.947658 1.4387302 Tests and confidence intervals on odds ratios are Wald based. What does the Y axis in this graph represent? The Odds of passing the midterm The Probability of failing the class The Odds of passing the class The Probability of passing the class
Nominal Logistic Fit for PassClass(Words) Logistic Plot 1.00 PassClass(Words) 0.75 0.50- 0.25 0.00 60 65 70 75 80 85 MidtermScore PassClass FailClass Converged in Gradient, 6 iterations Odds Ratios For PassClass(Words) odds of FailClass versus PassClass Unit Odds Ratios Per unit change in regressor Term Odds Ratio Lower 95% Upper 95% Reciprocal MidtermScore 0.695057 0.509788 0.947658 1.4387302 Tests and confidence intervals on odds ratios are Wald based. What does the Y axis in this graph represent? The Odds of passing the midterm The Probability of failing the class The Odds of passing the class The Probability of passing the class

Algebra and Trigonometry (MindTap Course List)
4th Edition
ISBN:9781305071742
Author:James Stewart, Lothar Redlin, Saleem Watson
Publisher:James Stewart, Lothar Redlin, Saleem Watson
Chapter4: Exponential And Logarithmic Functions
Section4.FOM: Focus On Modeling: Fitting Exponential And Power Curves To Data
Problem 10P

Related questions
Question
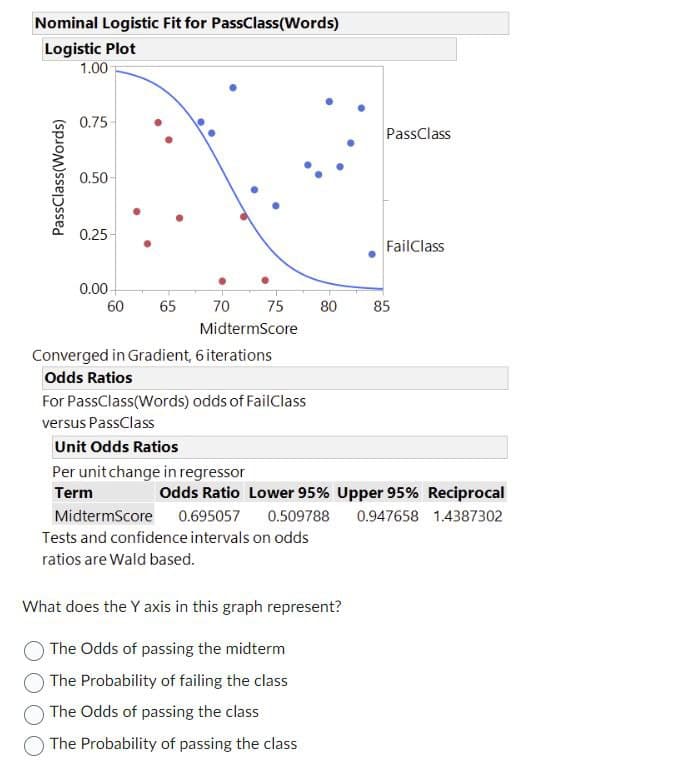
Transcribed Image Text:Nominal Logistic Fit for PassClass(Words)
Logistic Plot
1.00
PassClass(Words)
0.75
0.50-
0.25
0.00
60
65
70
75
80
85
MidtermScore
PassClass
FailClass
Converged in Gradient, 6 iterations
Odds Ratios
For PassClass(Words) odds of FailClass
versus PassClass
Unit Odds Ratios
Per unit change in regressor
Term
Odds Ratio Lower 95% Upper 95% Reciprocal
MidtermScore 0.695057 0.509788 0.947658 1.4387302
Tests and confidence intervals on odds
ratios are Wald based.
What does the Y axis in this graph represent?
The Odds of passing the midterm
The Probability of failing the class
The Odds of passing the class
The Probability of passing the class
Expert Solution
This question has been solved!
Explore an expertly crafted, step-by-step solution for a thorough understanding of key concepts.

Step by step
Solved in 2 steps

Recommended textbooks for you
Algebra and Trigonometry (MindTap Course List)
Algebra
ISBN:
9781305071742
Author:
James Stewart, Lothar Redlin, Saleem Watson
Publisher:
Cengage Learning

Functions and Change: A Modeling Approach to Coll…
Algebra
ISBN:
9781337111348
Author:
Bruce Crauder, Benny Evans, Alan Noell
Publisher:
Cengage Learning

College Algebra
Algebra
ISBN:
9781305115545
Author:
James Stewart, Lothar Redlin, Saleem Watson
Publisher:
Cengage Learning
Algebra and Trigonometry (MindTap Course List)
Algebra
ISBN:
9781305071742
Author:
James Stewart, Lothar Redlin, Saleem Watson
Publisher:
Cengage Learning
Functions and Change: A Modeling Approach to Coll…
Algebra
ISBN:
9781337111348
Author:
Bruce Crauder, Benny Evans, Alan Noell
Publisher:
Cengage Learning
College Algebra
Algebra
ISBN:
9781305115545
Author:
James Stewart, Lothar Redlin, Saleem Watson
Publisher:
Cengage Learning


College Algebra (MindTap Course List)
Algebra
ISBN:
9781305652231
Author:
R. David Gustafson, Jeff Hughes
Publisher:
Cengage Learning

Glencoe Algebra 1, Student Edition, 9780079039897…
Algebra
ISBN:
9780079039897
Author:
Carter
Publisher:
McGraw Hill