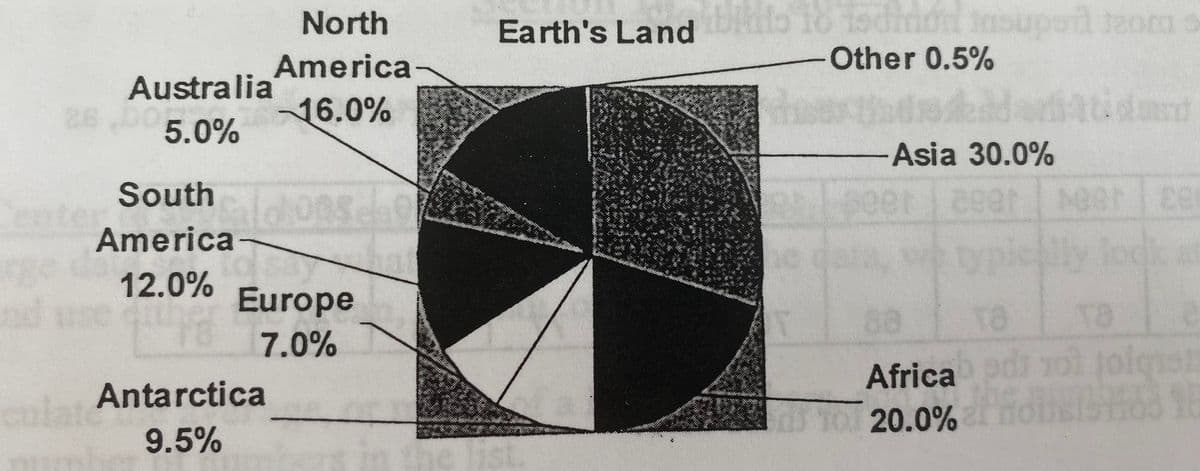
North Earth's Land lo Other 0.5% Australia 26 D 5.0% America 16.0% -Asia 30.0% South enter America- ge opielly loc lodka 12.0% Europe 88 7.0% Africa pdi ol jolqa Antarctica 20.0% 9.5%


Q: The following in a screeplot of a PCA analysis. How many PCs would you keep? Why?
A: PCA is the method to reduce the dimension of given datasets into smaller dimension datasets in such…
Q: 8. Refer to the following table summarizing results of a medical study. Answer the following using a…
A:
Q: What percent of the world's population speak Spanish or German? World Languages and the percents of…
A: Percentage of people who speak Spanish P(S)= 5% Percentage of people who speak German P(G)= 1% Per…
Q: On the right is a contingency table for active Naval military personnel, cross- classified by…
A: Given Data: Completing the table: G1 G2 G3 Total M1 118112 13912 72 132096 M2 14780 1482…
Q: Use the figure below to answer this question. What is coal mostly used for? Percentages of Sources…
A: We must read the web diagram for sources of energy to solve this problem
Q: Homework 10 ANOVA e complete the following summary table: rce SS df MS F ween 4.53
A: Given that : A anova table is given. Complete it by one way anova concept. D. F. (Total) = D.…
Q: It is estimated that 15% of teens own iphone. In the MDM4U class there are 25 teens who own…
A: Given that ; Estimated proportion (p) of teens own iPhone = 15 % In MDM4U class, Total students (…
Q: a survey conducted at the beginning of 2010, a hypothetical country with a total land area of…
A: NOTE-AS PER GUIDELINES I HAVE CALCULATED FIRST 3 SUBPARTS ONLY
Q: 1. Extremely liberal 2. Liberal3. Slightly liberal4. Moderate, middle of road 5. Slightly…
A: The hypotheses for the given scenario are, H0: µ=4 H1: µ≠4
Q: Туре Public Private T2 Total Elementary 36,161 4,073 40,234 High school L2 14,877 1,103 15,980…
A: Here Given Table PUBLIC PRIVATE TOTAL ELEMENTRY(L1) 36161 4073 40234 HIGH SCHOOL(L2) 14877…
Q: 4 60 70 80 90 100 Median: Click to add title Upper Quartile: Click to add title Lower Quartile:…
A:
Q: Question 3 Last year Peta had an annual income of $33,000. They paid $2,046.00 in Social Security…
A: 3. Given that Peta had an annual income of $33,000. Paid $2,046.00 in Social Security Tax $478.50…
Q: In a process capability analysis, LSL=30+X, USL=36+X, µ=32.5+X and o=1. What is the nonconforming…
A:
Q: The Population of a town in the last five censuses was given below. year 1940 1960 1970…
A:
Q: 18 16 4 6 8 10 12 14 16 Size (micrometers) © 2020 StrongMind. Created using GeoGebra. About how many…
A: The data is provided for 10,000 cells and the frequency is provided in percentage
Q: In an anti malarial campaign in a certain area, quinine was administered to 1,624 persons out of a…
A:
Q: If the population of Russia is 144,000,000, and its primacy rate is 11% and Moscow is its largest…
A:
Q: e hundred twenty two people who grew up in either City A or City B were surveyed to determine…
A:
Q: You are employed as a network engineer and have been asked to analyze a communication network to…
A: At A : 2x1 + x2 = 100 B : x1 + x2 - x3 - x5 = 0 C : x1 - x3 - x5 = -50 D : -x2 + x4 + x5 = 120 E :…
Q: 1 Evaluate 士V16 目 ?/1 (Level 2) Show Your Work
A:
Q: !! 4. 307-Eng 02/24 Pg-644HMH-ESS Population Density (people per km) City Land Area New York 8550405…
A:
Q: 33. Estimate the production of sugar for the year 2000 and 2010 from the following data : Year 1985…
A:
Q: vinds through an urban area and another in a suburban park. The table shows the number of users who…
A: Given data, Proportion of suburban park users bike on park trail=?
Q: 8. Two competing companies offer satellite television service to a city with 10,000 bouseh Figure 2…
A: Given:
Q: Identify the value of the test statistic. Source DF SS MS Factor 3. 30 10.00 16 0.264 Ernor 50 6.25…
A: In this context, the output for the One-Factor ANOVA is given. From the output, the F-test statistic…
Q: A sample of 5 adults reported the number of times per day that they washed their hands in January of…
A: For January 2020 Data: Standard Deviation, s : 1.581 Count, N: 5 Sum, Σx: 25 Mean, x̄: 5…
Q: The population of Amman during three census periods was as follows: Year: 2000 2010 2020 Population…
A:
Q: 12. In 2010 consumption (Ci) for selected countries was as follows Jordan 2.5 billion $, USA 100…
A: Given the data as Country Yi Ci Jordan 12 2.5 USA 900 100 Canada 700 50 France 500 40…
Q: 00 の) Origin FI R %24 File Edit View History Bookmarks Profiles Tab Window Help M Inbox (114) -…
A: a) Chi square test of independence, is used to check whether two categorical variables are related…
Q: 15. In 2010 consumption (Ci) for selected countries was as follows Jordan 2.5 billion $, USA 100…
A:
Q: Q: Using the demographics data posted below this question, apply the Excel Regression tool using…
A: The regression output with Unemployment as the dependent variable and cost of living as the…
Q: Find the number of people living with AIDS per thousand residents in each region by dividing the…
A: Given table is, Region AIDS Rank Cases Population Population (thousands) AIDS per 1000…
Q: The local government is concerned with the population of a new predatory fish, the tiger gar, which…
A: Given that the tiger gar fish was first observed 5 years ago. Which means that it was first…
Q: 12. asta Menu tem teak T almo any, should be adjusted or removed. Number Menu Sold hicke aesar 1…
A: Menu Mix % = Number item sold / total sold Item CM = Menu Price - Food Cost Gross Margin = Number…
Q: Assuming that the ratio of boys to girls is 2:3 in the children in all the years, how many more…
A:
Q: The purity of oxygen produced by a fractional distillation process is thought to be related to the…
A: Given the purity and hydrocarbon data of 20 samples as Purity Hydrocarbon 86.91 1.02 89.85…
Q: A company wants to compare how much two items sold over an 11-year span. The table below shows how…
A: Given the table is
Q: 1. The information provided below relates to sales in a dine-in restaurant in Salisbury Maryland:…
A:
Q: The table below shows the number of state-registered automatic weapons and the murder rate for…
A: Given xx = thousands of automatic weaponsyy = murders per 100,000 residents
Q: 12. The following table gives the quantity of cement in thousands of tonnes mamuferctured each year…
A:
Q: mammal or threatened foreign species)=
A:
Q: SHORT QUIZ Complete the following table using the data below. Area 35 1.20 48 36 48 83 75 1.90
A: Note: Please repost remaining sub-parts as I can author only 3 sub-parts as per my policy 1) Given…
Q: Table 2.10 Data for exercise 2.10 on auto accidents. Injury Restraint Use Fatal Nonfatal Total No…
A: *Answer:
Q: 12 13 14 15 16 17 18 19 data 7. 6. 10 11 Based on the boxplot above, identify the 5 number summary…
A: The five number summary is descriptive statistics that provides information about the data set. The…
Q: What is the degree of freedom (sd) in the analysis of a 4-by-5-dimensional table that is summarized…
A: The degrees of freedom can be calculated by subtracting the number of relations from the number of…
Q: The "(Subject Matter )" that best describe this Gauguin painting is? O Folklore O Imaginative O…
A: Let's find.
Q: The table below shows automatic weapons and Northwestern states. X Y 11.8 8.6 14.1 11.5 thousands of…
A: The given data is x y 11.8 14.1 8.6 11.5 7 9.8 3.3 7.1 2.5 6.2 2.5 6.5 2.6 6 0.9…
Q: A firm plans to test a new product in one randomly selected market area. The market areas can be…
A: From the population density table, the number of markets in East and Urban is 25. The total number…
Q: 8. In 2010 consumption (Ci) for selected countries was as follows Jordan 2.5 billion $, USA billion…
A: The value of Ci is given as: 2.5 100 50 40 10 70
Q: (c) different mean porosity values. Support your conclusions about each comparison. If post-hoc…
A: H0: There is no difference in porosity across the three rock types.Ha: At least porosity for one…
If Europe has approximatley 4.1 million mi2 of land, what is the total area of the land on Earth?


Trending now
This is a popular solution!

Step by step
Solved in 2 steps with 2 images

- NORTH–SOUTH AIRLINE CASENorthern Airline DataAirframe CostEngine CostAverage AgeYearper Aircraftper Aircraft(Hours)200151.8043.496,512200254.9238.588,404200369.7051.4811,077200468.9058.7211,717200563.7245.4713,2752006 84.7350.2615,215200778.7479.6018,390Southeast Airline DataAirframe CostEngine CostAverage AgeYearPer Aircraftper Aircraft(Hours)200113.2918.865,107200225.1531.558,145200332.1840.437,360200431.7822.105,773200525.3419.697,150200632.7832.589,364200735.5638.078,2591. Develop Regression equations for each cost category as dependent variables and average age as independent variables. Do this for each Airline. Look at graphs produced by QM2. From the regression results, what would you conclude about a) airframe vs engine costs for each airlineb) comparing airlines as to airframe costsc) comparing airlines as to engine costsd) Provide a brief summary report of your comparisonsJohnson Filtration, Inc. provides maintenance service for water-filtration systems. Suppose that in addition to information on the number of months since the machine was serviced and whether a mechanical or an electrical repair was necessary, the managers obtained a list showing which repairperson performed the service. Repair Time(hours) Months SinceLast Service Type ofRepair Repairperson 2.9 2 electrical Dave Newton 3.0 6 mechanical Dave Newton 4.8 8 electrical Bob Jones 1.8 3 mechanical Dave Newton 2.9 2 electrical Dave Newton 4.9 7 electrical Bob Jones 4.2 9 mechanical Bob Jones 4.8 8 mechanical Bob Jones 4.4 4 electrical Bob Jones 4.5 6 electrical Dave Newton Ignore for now the months since the last maintenance service (x1 ) and the repairperson who performed the service. Develop the estimated simple linear regression equation to predict the repair time (y) given the…Advil and Motrin IB produce the same headache relief medication with the active ingredient ibuprofen. Each pillshould contain 200 mg of ibuprofen. A health agency obtains a sample of ten tablets from both manufacturers and measureshow much ibuprofen each pill actually contains.Number of milligrams measuredAdvil 199.25 198.50 200.10 200.75 201.00 198.00 200.10 199.00 201.10 202.20Motrin IB 205.00 195.80 195.20 203.20 205.80 194.40 204.60 194.60 207.20 194.20(a) Verify on your calculator that each sample has a mean value of 200 mg.(b) What is the range of each sample?(c) However, based on the given sample values, which company would you prefer to buy from? Justify your answer with statisticalreasoning. (Hint: argue using standard deviation and explain why this is desirable in this situation)
- The doctors community wants to ensure that each and every individual is aware of the importance if taking corona vaccines ,so they want to see If educating the locals. Who will get the crona vaccine will increase theneorcentage of the adults who will get vaccines as soon as they are eligible to . Identify the who and what ( response varaible)Based upon a survey of 17000 California residents; Gallup Poll notes that, if the election were held today, over half of all voters would vote to recall Gov. Davis. This is an example of***Only do this question using Minitab and be sure to show images and steps used*** Using Minitab and Interpreting Results cpafirm.csv (data for minitab): amount0.001.200.431.001.470.830.503.341.581.46-0.36-1.102.600.000.00-1.700.831.990.001.34 Medlin and Associates is a regional certified public accounting (CPA) firm located near Minneapolis. Recently, a team conducted an audit for a discount chain. One part of the audit involved developing anestimate for the mean dollar error in total charges that occurs during the checkout process. The firm wishes to develop a 95% confidence interval estimate for the population mean. The data cpaf irm.csvcan be read into Minitab. Note that positive values indicate that the customer was overcharged. Your statistics instructor claims that 60 percent of the students who take her Elementary Statistics class go through life feeling more enriched. For some reason that she can’t quite figure out, mostpeople don’t believe her. You decide to check this…
- 31 Data: Red Blue Brown Green Yellow0.744 0.844 0.918 0.942 0.8680.813 0.726 0.743 0.798 0.7240.997 0.717 0.818 0.727 0.7540.927 0.882 0.994 0.842 0.9510.825 0.969 0.997 0.828 0.771 0.993 0.918 0.854 0.999 0.786 0.963 0.972 0.872 0.904 0.752Data on the gasoline tax per gallon (in cents) as of a certain date for the 50 U.S. states and the District of Columbia are shown below. State Gasoline Taxper Gallon State Gasoline Taxper Gallon Alabama 19.1 Missouri 17.4 Alaska 8.9 Montana 27.9 Arizona 19.1 Nebraska 27.8 Arkansas 21.7 Nevada 23.9 California 37.3 New Hampshire 23.9 Colorado 23.2 New Jersey 14.5 Connecticut 24.9 New Mexico 19.0 Delaware 22.9 New York 33.9 District ofColumbia 23.4 North Carolina 35.2 North Dakota 22.9 Florida 30.7 Ohio 27.9 Georgia 26.6 Oklahoma 17.1 Hawaii 18.4 Oregon 30.1 Idaho 33.1 Pennsylvania 51.5 Illinois 33.0 Rhode Island 34.0 Indiana 28.9 South Carolina 16.9 Iowa 31.7 South Dakota 30.1 Kansas 24.9 Tennessee 21.3 Kentucky 25.9 Texas 20.1 Louisiana 20.8 Utah 30.2 Maine 31.5 Vermont 30.6 Maryland 32.9 Virginia 16.9 Massachusetts 26.6 Washington 44.7 Michigan 31.0 West Virginia 33.1 Minnesota 30.7 Wisconsin 32.8 Mississippi 18.3 Wyoming 24.1 (a) The smallest value in the data set is 8.9 (Alaska) and…sample Al St 1 8.1 8 2 4.9 8.1 3 8.4 8.2 4 6.9 7.4 5 6.1 7.6 6 7.2 7 7 6.2 6.9 8 6.6 8.2 9 6.7 8.3 10 5.3 7.9 11 8.6 8.7 12 7.7 9.7 13 6 7.5 14 9.1 5.8 In a manufacturing application, a aluminum alloy is replacing a previous steel alloy as the mainstructural component. In order to maintain the same performance, it is important to assess whetheror not the new alloy has the same coefficient of thermal expansion (CoTE) as the previous material.(a) Perform a hypothesis test to determine if their is strong evidence for the claim that there is adifference in the CoTE for these two materials to α = 0.01 level.(b) Construct a 95% confidence interval for the difference in the two population mean CoTE, µ1 −µ2.(c) Construct a plot that supports your results from part (a)
- In many colleges, educators are changing their approach to instruction from a “teacher/lecture-centeredmodel” to a “student-centered model” where students learn in a laboratory environment in which lectureis deemphasized and students can proceed at a pace suitable to their learning needs. In once schoolwhere this model was being introduced, of the 743 students who enrolled in the traditional lecture model, 364 passed; of the 567 in the student-centered model, 335 passed. Use a 0.05 level ofsignificance to test the claim that student-centered model results in a higher pass rate than the traditionalmodel?Kentville, a community of 10,000 people, resides next to a krypton mine, and there is a concern that the emission from the krypton smelter have resulted in adverse effects. Specifically, Kryptonosis seems to have killed 12 of Kentville’s inhabitants last year. A neighboring community, Lanesburg, has 25,000 inhabitants and is far enough from the smelter to not be affected by the emission. In Lanesburg, only three people last year died of Kryptonosis. Given that the number of deaths in Kentville and their causes last year were: Heart attack=7 Accidents=4 Kryptonosis=12 Other=6 What is the risk of dying of Kryptonosis in Kentville relative to non-contaminated locality?What is the risk of dying of Kryptonosis in Kentville relative to deaths due to other causes? How many times the chance of dying of Kryptonosis compared to dying of accidents ? How many times the chance of dying of Kryptonosis compared to Other causes?9. You work for an insurance company and are studying the relationship between types of crashes and the vehicles involved. As part of your study, you randomly select 3207 vehicle crashes and organize the resulting data as shown in the contingency table. At ? = 0.05, can you conclude that the type of crash depends on the type of vehicle?Vehicle Type of crash Car Lorry VanSingle-vehicle 895 493 45Multiple-vehicle 1400 336 38
