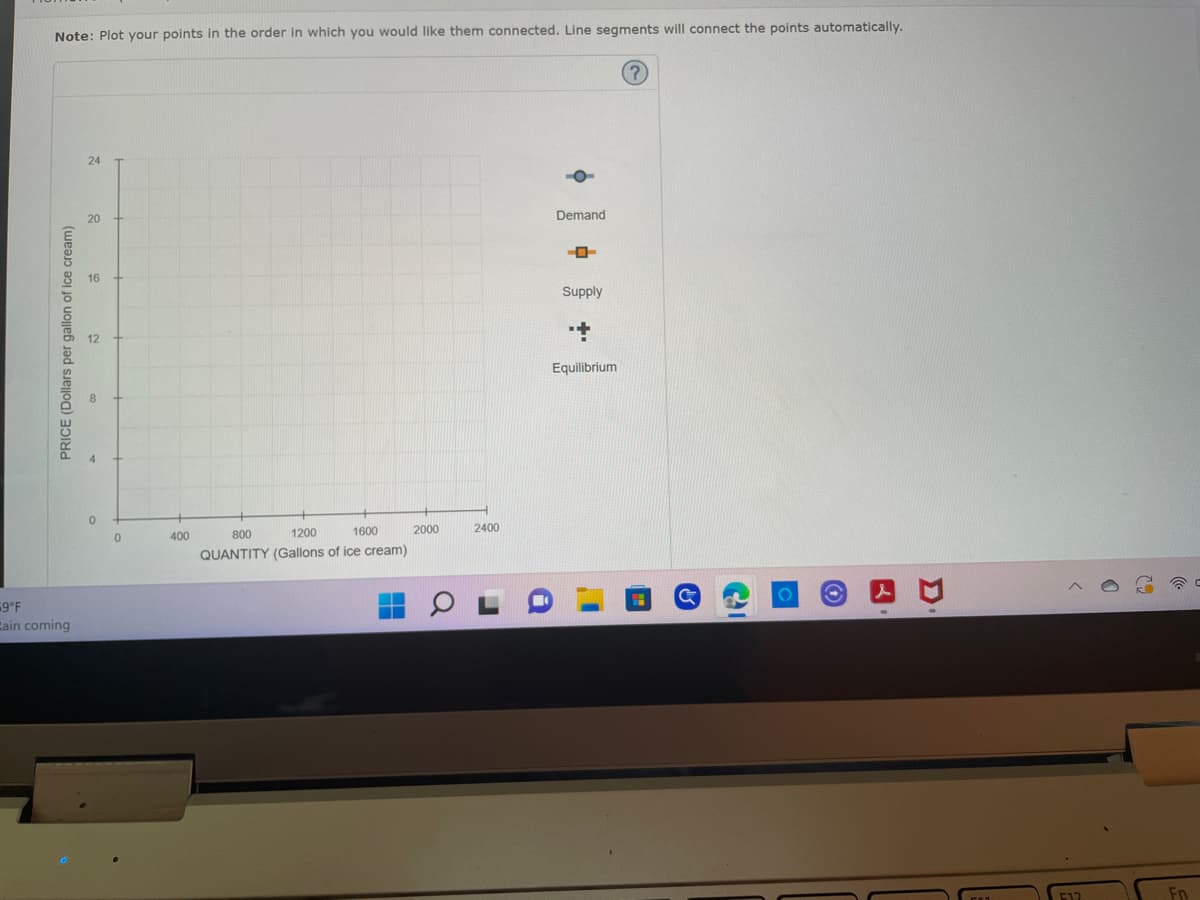
Note: Plot your points in the order in which you would like them connected. Line segments will connect the points automatically. 24 20 Demand Supply + Equilibrium PRICE (Dollars per gallon of ice cream) 16 0 0 400 800 1200 1600 QUANTITY (Gallons of ice cream) 2000 2400
Note: Plot your points in the order in which you would like them connected. Line segments will connect the points automatically. 24 20 Demand Supply + Equilibrium PRICE (Dollars per gallon of ice cream) 16 0 0 400 800 1200 1600 QUANTITY (Gallons of ice cream) 2000 2400

Chapter6: Elasticity
Section: Chapter Questions
Problem 12QP

Related questions
Question
Transcribed Image Text:Note: Plot your points in the order in which you would like them connected. Line segments will connect the points automatically.
?
24
20
Demand
-0-
Supply
Equilibrium
PRICE (Dollars per gallon of ice cream)
59°F
Zain coming
0
0
400
800
1200
1600
QUANTITY (Gallons of ice cream)
2000
2400
I'
Ca
F12
Fn
Transcribed Image Text:Homework (CIT
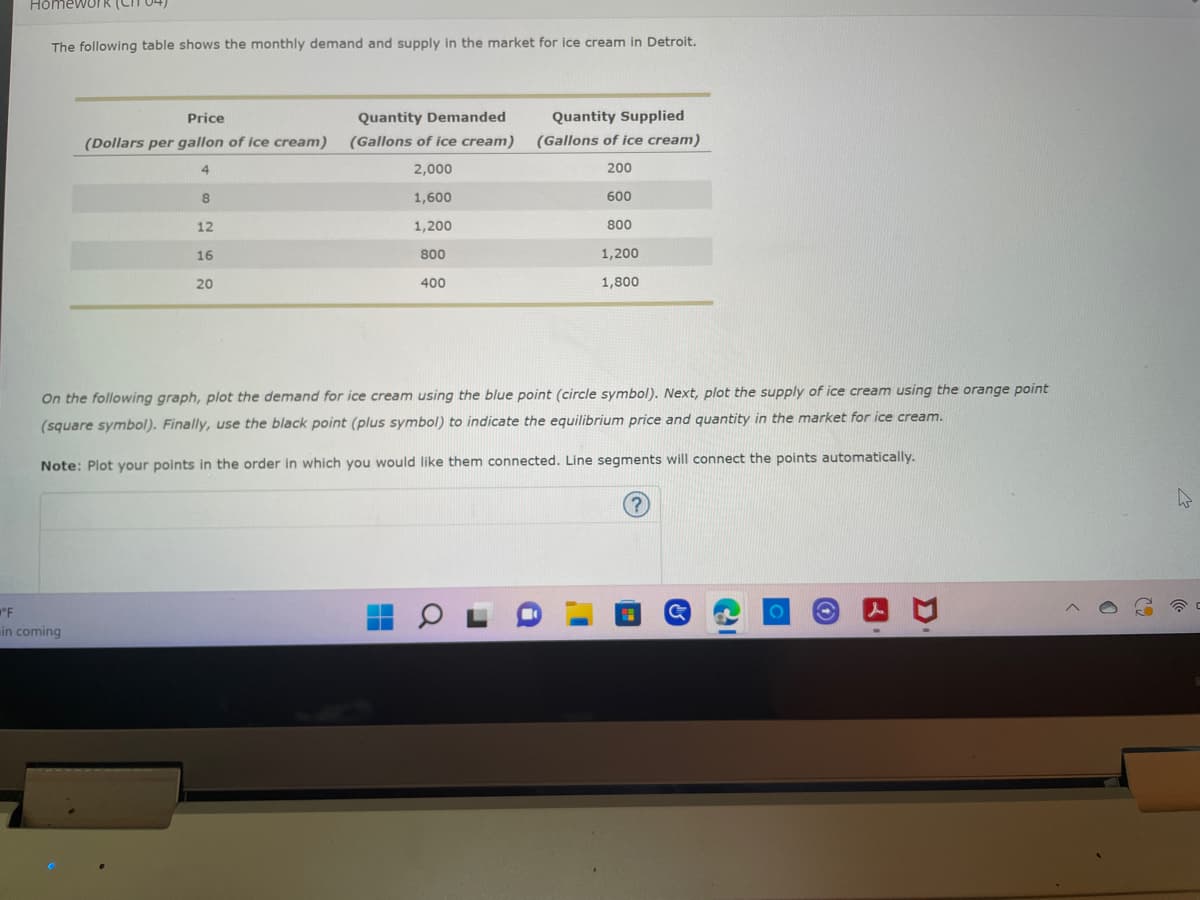
The following table shows the monthly demand and supply in the market for ice cream in Detroit.
Price
Quantity Demanded
(Gallons of ice cream)
Quantity Supplied
(Gallons of ice cream)
(Dollars per gallon of ice cream)
4
2,000
200
8
1,600
600
12
1,200
800
16
800
1,200
20
400
1,800
On the following graph, plot the demand for ice cream using the blue point (circle symbol). Next, plot the supply of ice cream using the orange point
(square symbol). Finally, use the black point (plus symbol) to indicate the equilibrium price and quantity in the market for ice cream.
Note: Plot your points in the order in which you would like them connected. Line segments will connect the points automatically.
°F
in coming
CI
h
((
Expert Solution
This question has been solved!
Explore an expertly crafted, step-by-step solution for a thorough understanding of key concepts.

This is a popular solution!

Trending now
This is a popular solution!

Step by step
Solved in 2 steps with 1 images

Knowledge Booster


Learn more about
Need a deep-dive on the concept behind this application? Look no further. Learn more about this topic, economics and related others by exploring similar questions and additional content below.Recommended textbooks for you

Economics (MindTap Course List)
Economics
ISBN:
9781337617383
Author:
Roger A. Arnold
Publisher:
Cengage Learning

Economics (MindTap Course List)
Economics
ISBN:
9781337617383
Author:
Roger A. Arnold
Publisher:
Cengage Learning


Principles of Economics 2e
Economics
ISBN:
9781947172364
Author:
Steven A. Greenlaw; David Shapiro
Publisher:
OpenStax
