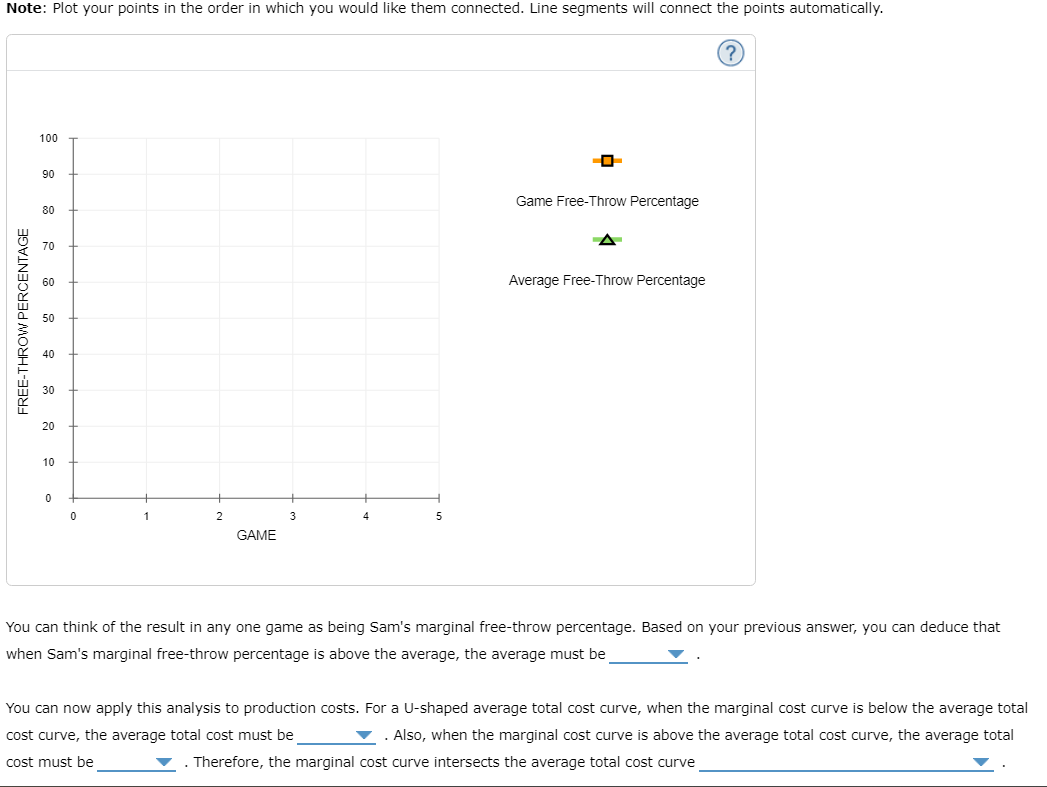
Note: Plot your points in the order in which you would like them connected. Line segments will connect the points automatically. (?) FREE-THROW PERCENTAGE 100 90 80 70 60 50 40 30 20 10 0 0 2 GAME 3 5 -O- Game Free-Throw Percentage Average Free-Throw Percentage You can think of the result in any one game as being Sam's marginal free-throw percentage. Based on your previous answer, you can deduce that when Sam's marginal free-throw percentage is above the average, the average must be You can now apply this analysis to production costs. For a U-shaped average total cost curve, when the marginal cost curve is below the average tota cost curve, the average total cost must be . Also, when the marginal cost curve is above the average total cost curve, the average total ▼. Therefore, the marginal cost curve intersects the average total cost curve cost must be
Note: Plot your points in the order in which you would like them connected. Line segments will connect the points automatically. (?) FREE-THROW PERCENTAGE 100 90 80 70 60 50 40 30 20 10 0 0 2 GAME 3 5 -O- Game Free-Throw Percentage Average Free-Throw Percentage You can think of the result in any one game as being Sam's marginal free-throw percentage. Based on your previous answer, you can deduce that when Sam's marginal free-throw percentage is above the average, the average must be You can now apply this analysis to production costs. For a U-shaped average total cost curve, when the marginal cost curve is below the average tota cost curve, the average total cost must be . Also, when the marginal cost curve is above the average total cost curve, the average total ▼. Therefore, the marginal cost curve intersects the average total cost curve cost must be

Chapter1: Making Economics Decisions
Section: Chapter Questions
Problem 1QTC

Related questions
Question
Transcribed Image Text:Note: Plot your points in the order in which you would like them connected. Line segments will connect the points automatically.
(?)
FREE-THROW PERCENTAGE
100
90
80
70
30
20
10
0
0
1
2
GAME
3
5
Game Free-Throw Percentage
Average Free-Throw Percentage
You can think of the result in any one game as being Sam's marginal free-throw percentage. Based on your previous answer, you can deduce that
when Sam's marginal free-throw percentage is above the average, the average must be
You can now apply this analysis to production costs. For a U-shaped average total cost curve, when the marginal cost curve is below the average total
cost curve, the average total cost must be
Also, when the marginal cost curve is above the average total cost curve, the average total
cost must be
. Therefore, the marginal cost curve intersects the average total cost curve
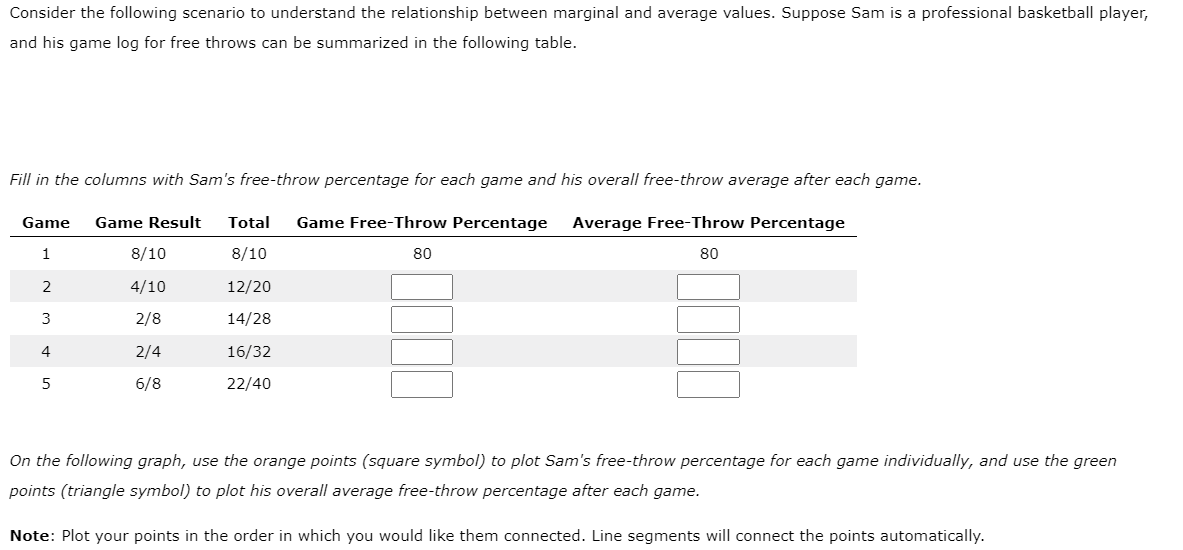
Transcribed Image Text:Consider the following scenario to understand the relationship between marginal and average values. Suppose Sam is a professional basketball player,
and his game log for free throws can be summarized in the following table.
Fill in the columns with Sam's free-throw percentage for each game and his overall free-throw average after each game.
Game Result Total Game Free-Throw Percentage Average Free-Throw Percentage
Game
1
8/10
80
12/20
14/28
16/32
22/40
2
3
4
5
8/10
4/10
2/8
2/4
6/8
80
On the following graph, use the orange points (square symbol) to plot Sam's free-throw percentage for each game individually, and use the green
points (triangle symbol) to plot his overall average free-throw percentage after each game.
Note: Plot your points in the order in which you would like them connected. Line segments will connect the points automatically.
Expert Solution
This question has been solved!
Explore an expertly crafted, step-by-step solution for a thorough understanding of key concepts.

Step by step
Solved in 3 steps with 1 images

Knowledge Booster


Learn more about
Need a deep-dive on the concept behind this application? Look no further. Learn more about this topic, economics and related others by exploring similar questions and additional content below.Recommended textbooks for you

Principles of Economics (12th Edition)
Economics
ISBN:
9780134078779
Author:
Karl E. Case, Ray C. Fair, Sharon E. Oster
Publisher:
PEARSON

Engineering Economy (17th Edition)
Economics
ISBN:
9780134870069
Author:
William G. Sullivan, Elin M. Wicks, C. Patrick Koelling
Publisher:
PEARSON
Principles of Economics (12th Edition)
Economics
ISBN:
9780134078779
Author:
Karl E. Case, Ray C. Fair, Sharon E. Oster
Publisher:
PEARSON
Engineering Economy (17th Edition)
Economics
ISBN:
9780134870069
Author:
William G. Sullivan, Elin M. Wicks, C. Patrick Koelling
Publisher:
PEARSON

Principles of Economics (MindTap Course List)
Economics
ISBN:
9781305585126
Author:
N. Gregory Mankiw
Publisher:
Cengage Learning

Managerial Economics: A Problem Solving Approach
Economics
ISBN:
9781337106665
Author:
Luke M. Froeb, Brian T. McCann, Michael R. Ward, Mike Shor
Publisher:
Cengage Learning

Managerial Economics & Business Strategy (Mcgraw-…
Economics
ISBN:
9781259290619
Author:
Michael Baye, Jeff Prince
Publisher:
McGraw-Hill Education