nouily al rices is depicted in the following table. Draw the supply curve of each individual and arket supply. Take a picture of your diagrams and upload with your answer. Market sup el us assume an nomy Iirms A, B and C whose supply ol a A's supply B's supply C's supply 1 4 3 4 8 6 10
nouily al rices is depicted in the following table. Draw the supply curve of each individual and arket supply. Take a picture of your diagrams and upload with your answer. Market sup el us assume an nomy Iirms A, B and C whose supply ol a A's supply B's supply C's supply 1 4 3 4 8 6 10

Essentials of Economics (MindTap Course List)
8th Edition
ISBN:9781337091992
Author:N. Gregory Mankiw
Publisher:N. Gregory Mankiw
Chapter4: The Market Forces Of Supply And Demand
Section: Chapter Questions
Problem 6QR

Related questions
Question
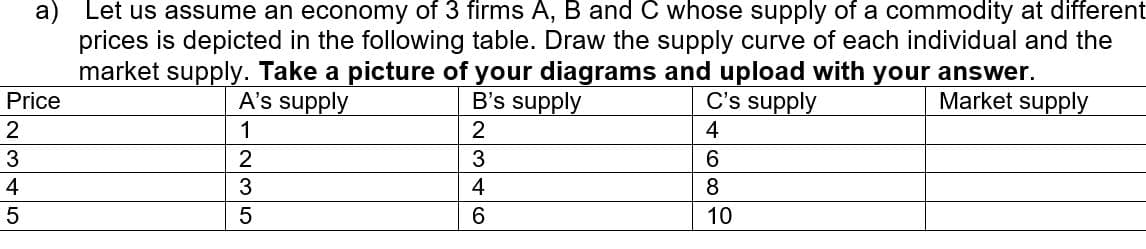
Transcribed Image Text:a) Let us assume an economy of 3 firms A, B and C whose supply of a commodity at different
prices is depicted in the following table. Draw the supply curve of each individual and the
market supply. Take a picture of your diagrams and upload with your answer.
B's supply
Price
A's supply
C's supply
Market supply
1
4
2
6.
3
8
10
346
2345
Expert Solution
This question has been solved!
Explore an expertly crafted, step-by-step solution for a thorough understanding of key concepts.

Step by step
Solved in 2 steps with 6 images

Knowledge Booster


Learn more about
Need a deep-dive on the concept behind this application? Look no further. Learn more about this topic, economics and related others by exploring similar questions and additional content below.Recommended textbooks for you
Essentials of Economics (MindTap Course List)
Economics
ISBN:
9781337091992
Author:
N. Gregory Mankiw
Publisher:
Cengage Learning

Principles of Microeconomics
Economics
ISBN:
9781305156050
Author:
N. Gregory Mankiw
Publisher:
Cengage Learning

Principles of Economics 2e
Economics
ISBN:
9781947172364
Author:
Steven A. Greenlaw; David Shapiro
Publisher:
OpenStax
Essentials of Economics (MindTap Course List)
Economics
ISBN:
9781337091992
Author:
N. Gregory Mankiw
Publisher:
Cengage Learning
Principles of Microeconomics
Economics
ISBN:
9781305156050
Author:
N. Gregory Mankiw
Publisher:
Cengage Learning
Principles of Economics 2e
Economics
ISBN:
9781947172364
Author:
Steven A. Greenlaw; David Shapiro
Publisher:
OpenStax

Exploring Economics
Economics
ISBN:
9781544336329
Author:
Robert L. Sexton
Publisher:
SAGE Publications, Inc