Now assume that the marginal costs of reading have decreased. On the graph, shift the marginal-cost curve (an orange line) to reflect the change in the marginal costs of reading. Then use the gray point (a star symbol) to plot the new efficient point after the shift in the marginal-cost curve. Finally, use the tan area (rectangle symbols) to shade the area representing the change in net benefits associated with this decrease in the marginal cost of reading. After the decrease in the marginal cost of reading, the new efficient level of reading is benefits associated with the efficient level of reading have than it was previously. Furthermore, the net
Now assume that the marginal costs of reading have decreased. On the graph, shift the marginal-cost curve (an orange line) to reflect the change in the marginal costs of reading. Then use the gray point (a star symbol) to plot the new efficient point after the shift in the marginal-cost curve. Finally, use the tan area (rectangle symbols) to shade the area representing the change in net benefits associated with this decrease in the marginal cost of reading. After the decrease in the marginal cost of reading, the new efficient level of reading is benefits associated with the efficient level of reading have than it was previously. Furthermore, the net

Chapter1: What Economics Is About
Section: Chapter Questions
Problem 1WNG

Related questions
Question
Note:-
Do not provide handwritten solution. Maintain accuracy and quality in your answer. Take care of plagiarism.
Answer completely.
You will get up vote for sure.
Transcribed Image Text:umbers and Papas! Chapter 01
MARGINAL COST, MARGINAL BENEFIT ($ per hour
14
12
2
6
an
4
N
1
2
3 4 5 6 7
READING (Hours per week)
.
MC
MB
9 10
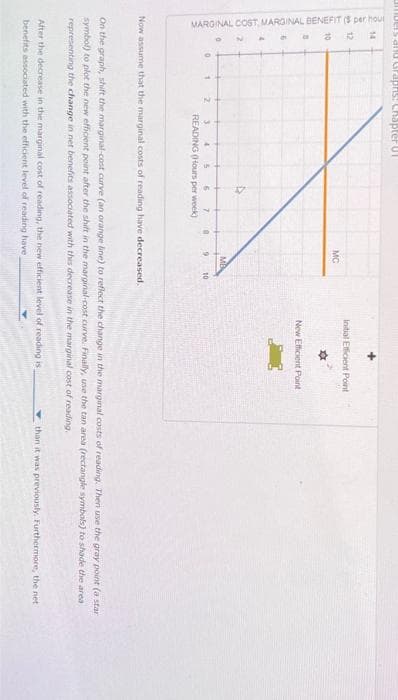
Now assume that the marginal costs of reading have decreased.
Initial Efficient Point
★
New Efficient Point
On the graph, shift the marginal-cost curve (an orange line) to reflect the change in the marginal costs of reading. Then use the gray point (a star
symbol) to plot the new efficient point after the shift in the marginal-cost curve. Finally, use the tan area (rectangle symbals) to shade the area
representing the change in net benefits associated with this decrease in the marginal cost of reading.
After the decrease in the marginal cost of reading, the new efficient level of reading is
benefits associated with the efficient level of reading have
than it was previously. Furthermore, the net
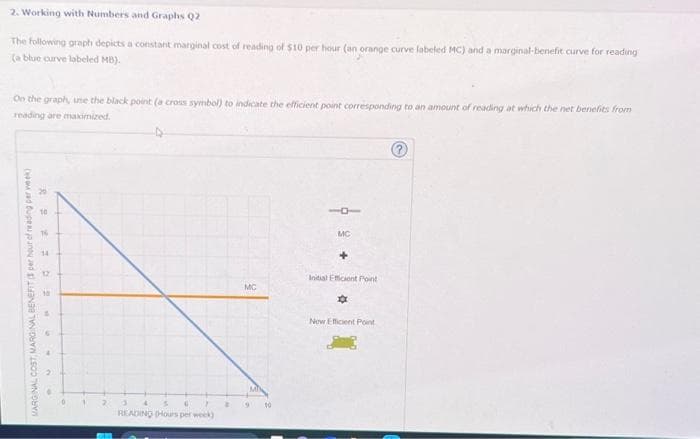
Transcribed Image Text:2. Working with Numbers and Graphs Q2
The following graph depicts a constant marginal cost of reading of $10 per hour (an orange curve labeled MC) and a marginal-benefit curve for reading
(a blue curve labeled MB).
On the graph, use the black point (a cross symbol) to indicate the efficient point corresponding to an amount of reading at which the net benefits from
reading are maximized.
MARGINAL COST, MARGINAL BENEFIT ( per hour of reading per week)
16
12
2
0 7
READING (Hours per week)
B
MC
9
10
MC
+
Initial Efficient Point
33
New Efficient Point
Expert Solution
This question has been solved!
Explore an expertly crafted, step-by-step solution for a thorough understanding of key concepts.

This is a popular solution!

Trending now
This is a popular solution!

Step by step
Solved in 3 steps with 1 images

Knowledge Booster


Learn more about
Need a deep-dive on the concept behind this application? Look no further. Learn more about this topic, economics and related others by exploring similar questions and additional content below.Recommended textbooks for you

Economics (MindTap Course List)
Economics
ISBN:
9781337617383
Author:
Roger A. Arnold
Publisher:
Cengage Learning

Economics (MindTap Course List)
Economics
ISBN:
9781337617383
Author:
Roger A. Arnold
Publisher:
Cengage Learning

Principles of Economics 2e
Economics
ISBN:
9781947172364
Author:
Steven A. Greenlaw; David Shapiro
Publisher:
OpenStax

Principles of Economics (MindTap Course List)
Economics
ISBN:
9781305585126
Author:
N. Gregory Mankiw
Publisher:
Cengage Learning

Principles of Microeconomics (MindTap Course List)
Economics
ISBN:
9781305971493
Author:
N. Gregory Mankiw
Publisher:
Cengage Learning