Now it's time to create, analyze and interpret a Chemistry-based graph! Let's do this in steps. Data Measurement number Temperature (°C) Solubility (g NaCl/100 g water) 1 0.00 35.2 2 20.0 36.1 40.0 37.0 4 60.0 37.7 5 80.0 38.4 6 100.0 39.0 Let's assume that you just finished your first research laboratory experiment and you collected the data listed above. Pay close attention to the titles. Based on the titles listed answer and complete the following:
Now it's time to create, analyze and interpret a Chemistry-based graph! Let's do this in steps. Data Measurement number Temperature (°C) Solubility (g NaCl/100 g water) 1 0.00 35.2 2 20.0 36.1 40.0 37.0 4 60.0 37.7 5 80.0 38.4 6 100.0 39.0 Let's assume that you just finished your first research laboratory experiment and you collected the data listed above. Pay close attention to the titles. Based on the titles listed answer and complete the following:

Introductory Chemistry: An Active Learning Approach
6th Edition
ISBN:9781305079250
Author:Mark S. Cracolice, Ed Peters
Publisher:Mark S. Cracolice, Ed Peters
Chapter2: Matter And Energy
Section: Chapter Questions
Problem 2.4TC: Specific gravity is a physical property. Beakers hold three clear, colorless liquids A, B, and C....

Related questions

Question
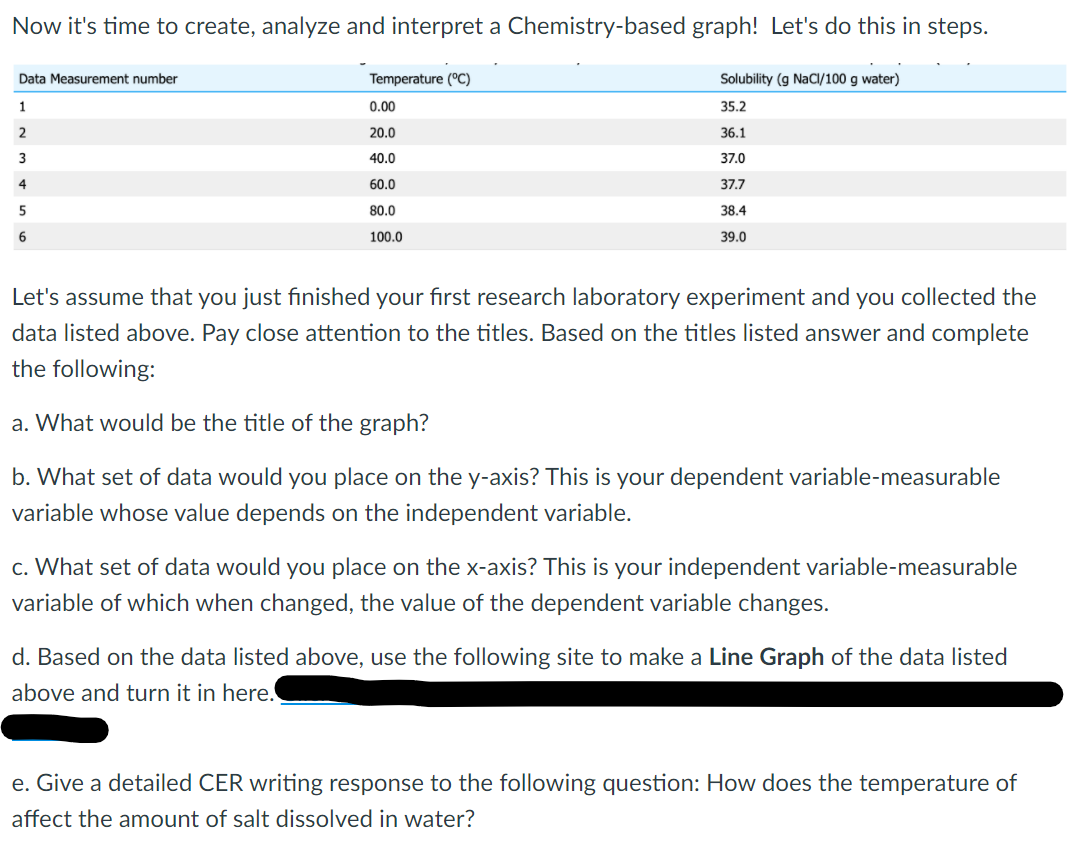
Transcribed Image Text:Now it's time to create, analyze and interpret a Chemistry-based graph! Let's do this in steps.
Data Measurement number
Temperature (°C)
Solubility (g NaCl/100 g water)
1
0.00
35.2
2
20.0
36.1
3
40.0
37.0
4
60.0
37.7
5
80.0
38.4
100.0
39.0
Let's assume that you just finished your first research laboratory experiment and you collected the
data listed above. Pay close attention to the titles. Based on the titles listed answer and complete
the following:
a. What would be the title of the graph?
b. What set of data would you place on the y-axis? This is your dependent variable-measurable
variable whose value depends on the independent variable.
c. What set of data would you place on the x-axis? This is your independent variable-measurable
variable of which when changed, the value of the dependent variable changes.
d. Based on the data listed above, use the following site to make a Line Graph of the data listed
above and turn it in here.
e. Give a detailed CER writing response to the following question: How does the temperature of
affect the amount of salt dissolved in water?
Expert Solution
This question has been solved!
Explore an expertly crafted, step-by-step solution for a thorough understanding of key concepts.

This is a popular solution!

Trending now
This is a popular solution!

Step by step
Solved in 2 steps with 1 images

Knowledge Booster


Learn more about
Need a deep-dive on the concept behind this application? Look no further. Learn more about this topic, chemistry and related others by exploring similar questions and additional content below.Recommended textbooks for you
Introductory Chemistry: An Active Learning Approa…
Chemistry
ISBN:
9781305079250
Author:
Mark S. Cracolice, Ed Peters
Publisher:
Cengage Learning

Chemistry: The Molecular Science
Chemistry
ISBN:
9781285199047
Author:
John W. Moore, Conrad L. Stanitski
Publisher:
Cengage Learning
Introductory Chemistry: An Active Learning Approa…
Chemistry
ISBN:
9781305079250
Author:
Mark S. Cracolice, Ed Peters
Publisher:
Cengage Learning
Chemistry: The Molecular Science
Chemistry
ISBN:
9781285199047
Author:
John W. Moore, Conrad L. Stanitski
Publisher:
Cengage Learning