Now, using the values for the means that you just calculated, fill out the following table by calculating the deviations from the means for X and Y, the squares of the deviations, and the products of the deviations. Scores X Y 1 00 8 7 2 6 3 9 4 0 10 Deviations X-Mx Y - My The sum of squares for x is SS₂ = Squared Deviations Products (X-Mx)² (Y - My)² (X-MX)(Y - My) Because the sign of the sum of products is The correlation coefficient is r = The sum of squares for y is SSy = The sum of products is SP = the sign of the correlation coefficient Look at your scatter diagram again. If you excluded the point (0, 10), you would expect the recalculated correlation coefficient to be because
Now, using the values for the means that you just calculated, fill out the following table by calculating the deviations from the means for X and Y, the squares of the deviations, and the products of the deviations. Scores X Y 1 00 8 7 2 6 3 9 4 0 10 Deviations X-Mx Y - My The sum of squares for x is SS₂ = Squared Deviations Products (X-Mx)² (Y - My)² (X-MX)(Y - My) Because the sign of the sum of products is The correlation coefficient is r = The sum of squares for y is SSy = The sum of products is SP = the sign of the correlation coefficient Look at your scatter diagram again. If you excluded the point (0, 10), you would expect the recalculated correlation coefficient to be because

Functions and Change: A Modeling Approach to College Algebra (MindTap Course List)
6th Edition
ISBN:9781337111348
Author:Bruce Crauder, Benny Evans, Alan Noell
Publisher:Bruce Crauder, Benny Evans, Alan Noell
Chapter3: Straight Lines And Linear Functions
Section3.3: Modeling Data With Linear Functions
Problem 15SBE

Related questions
Question
100%
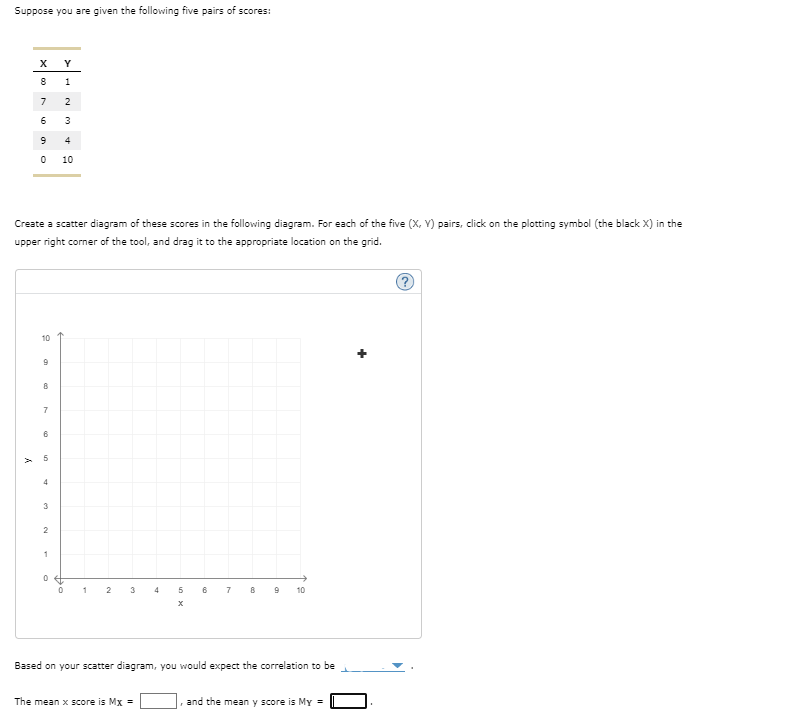
Transcribed Image Text:Suppose you are given the following five pairs of scores:
X
Y
8
1
7
2
6
3
9
4
0 10
Create a scatter diagram of these scores in the following diagram. For each of the five (X, Y) pairs, click on the plotting symbol (the black X) in the
upper right corner of the tool, and drag it to the appropriate location on the grid.
y
10
9
8
7
6
5
4
3
2
1
0
0
1
2
3
4
The mean x score is Mx =
5
x
7
10
Based on your scatter diagram, you would expect the correlation to be
and the mean y score is My =
?
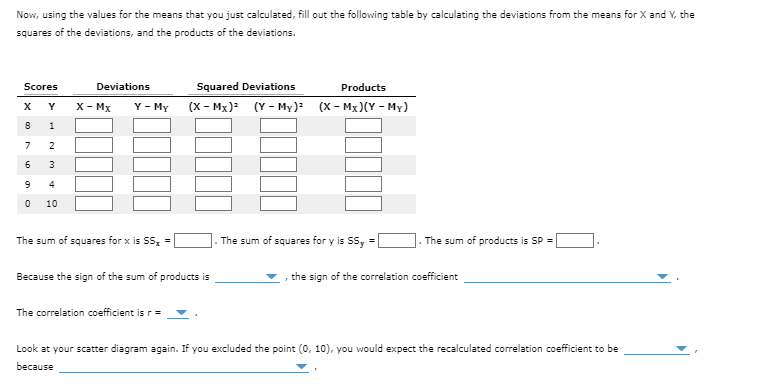
Transcribed Image Text:Now, using the values for the means that you just calculated, fill out the following table by calculating the deviations from the means for X and Y, the
squares of the deviations, and the products of the deviations.
Scores
X Y
1
00
8
7 2
6
3
9
4
0
10
Deviations
X-Mx Y - My
The sum of squares for x is SS₂ =
Squared Deviations
Products
(X-Mx)² (Y - My)² (X-MX)(Y - My)
Because the sign of the sum of products is
The correlation coefficient is r =
The sum of squares for y is SSy
=
The sum of products is SP =
the sign of the correlation coefficient
Look at your scatter diagram again. If you excluded the point (0, 10), you would expect the recalculated correlation coefficient to be
because
Expert Solution
This question has been solved!
Explore an expertly crafted, step-by-step solution for a thorough understanding of key concepts.

This is a popular solution!

Trending now
This is a popular solution!

Step by step
Solved in 4 steps with 3 images

Recommended textbooks for you
Functions and Change: A Modeling Approach to Coll…
Algebra
ISBN:
9781337111348
Author:
Bruce Crauder, Benny Evans, Alan Noell
Publisher:
Cengage Learning
Functions and Change: A Modeling Approach to Coll…
Algebra
ISBN:
9781337111348
Author:
Bruce Crauder, Benny Evans, Alan Noell
Publisher:
Cengage Learning