nts SS rary ons Listed below are amounts of court income and salaries paid to the town justices. All amounts are in thousands of dollars. Construct a scatterplot, find the value of the linear correlation coefficient r, and find the P-value using a = 0.05. Is there sufficient evidence to conclude that there is a linear correlation between court incomes and justice salaries? Based on the results, does it appear that justices might profit by levying larger fines? Court Income Justice Salary 64.0 406.0 1567.0 1132.0 274.0 251.0 110.0 153.0 33.0 46 92 58 45 61 25 26 19 31 ... OA. Ho: p*0 OB. Hop=0 H₁: p<0 H₁: p=0 OC. Ho: p=0 H₁: p>0 D. Ho: p=0 H₁: p#0 Construct a scatterplot. Choose the correct graph below. OA. B. OD. AJustice Salary A Justice Salary Q AJustice Salary 100+ Q 100+ 100- 1. C O Ott 50 50- 50- n O 0 1600 800 1600 800 Court Income The linear correlation coefficient is r= (Round to three decimal places as needed.) 0- → D 0 800 1600 Court Income Q OC. 100+ 50 0 Court Income Q A Justice Salary 0 800 1600 Court Income
nts SS rary ons Listed below are amounts of court income and salaries paid to the town justices. All amounts are in thousands of dollars. Construct a scatterplot, find the value of the linear correlation coefficient r, and find the P-value using a = 0.05. Is there sufficient evidence to conclude that there is a linear correlation between court incomes and justice salaries? Based on the results, does it appear that justices might profit by levying larger fines? Court Income Justice Salary 64.0 406.0 1567.0 1132.0 274.0 251.0 110.0 153.0 33.0 46 92 58 45 61 25 26 19 31 ... OA. Ho: p*0 OB. Hop=0 H₁: p<0 H₁: p=0 OC. Ho: p=0 H₁: p>0 D. Ho: p=0 H₁: p#0 Construct a scatterplot. Choose the correct graph below. OA. B. OD. AJustice Salary A Justice Salary Q AJustice Salary 100+ Q 100+ 100- 1. C O Ott 50 50- 50- n O 0 1600 800 1600 800 Court Income The linear correlation coefficient is r= (Round to three decimal places as needed.) 0- → D 0 800 1600 Court Income Q OC. 100+ 50 0 Court Income Q A Justice Salary 0 800 1600 Court Income

Glencoe Algebra 1, Student Edition, 9780079039897, 0079039898, 2018
18th Edition
ISBN:9780079039897
Author:Carter
Publisher:Carter
Chapter4: Equations Of Linear Functions
Section4.5: Correlation And Causation
Problem 15PPS

Related questions
Question
Second part to this question is also what is test statistic t=
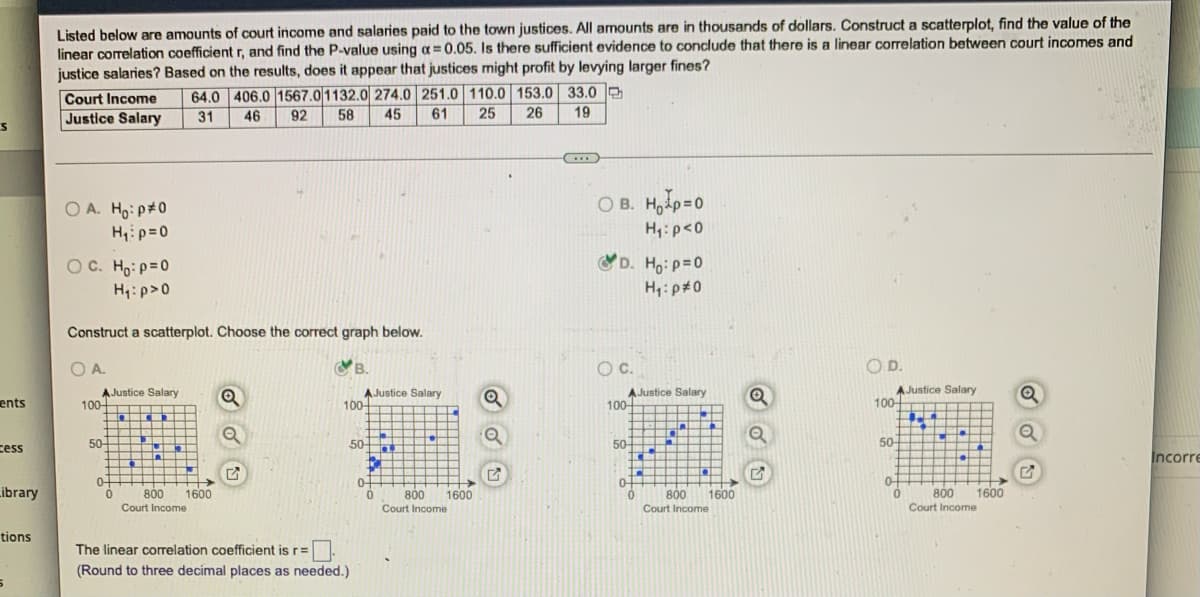
Transcribed Image Text:Listed below are amounts of court income and salaries paid to the town justices. All amounts are in thousands of dollars. Construct a scatterplot, find the value of the
linear correlation coefficient r, and find the P-value using a = 0.05. Is there sufficient evidence to conclude that there is a linear correlation between court incomes and
justice salaries? Based on the results, does it appear that justices might profit by levying larger fines?
Court Income
64.0 406.0 1567.0 1132.0 274.0 251.0 110.0 153.0 33.0
31 46 92 58 45 61 25 26
19
Justice Salary
S
OA. Ho:p*0
OB. H₂p=0
H₁: p<0
H₁: p=0
OC. Ho: p=0
H₁: p>0
D. Ho: p=0
H₁: p#0
Construct a scatterplot. Choose the correct graph below.
OA.
B.
OD.
A Justice Salary
A Justice Salary
A Justice Salary
Q
100
100-
▬▬▬▬▬▬▬
n C
14
•
HHH
HHH
50H
HHH
HHL
0-
1600
800 1600
800
Court Income
800
Court Income
The linear correlation coefficient is r=
(Round to three decimal places as needed.)
0.
ents
cess
Library
tions
5
0
G
100-
50-
0-
0
1600
Q
Q
O C.
100-
50-
0-
Court Income
Q
A Justice Salary
H
→
n
PH
•
50-
0
0
T
800
Court Income
1600
Incorre
Expert Solution
This question has been solved!
Explore an expertly crafted, step-by-step solution for a thorough understanding of key concepts.

This is a popular solution!

Trending now
This is a popular solution!

Step by step
Solved in 3 steps with 2 images

Recommended textbooks for you
Glencoe Algebra 1, Student Edition, 9780079039897…
Algebra
ISBN:
9780079039897
Author:
Carter
Publisher:
McGraw Hill
Glencoe Algebra 1, Student Edition, 9780079039897…
Algebra
ISBN:
9780079039897
Author:
Carter
Publisher:
McGraw Hill