Number of fires x 58 47 84 62 57 72 69 Number of acres burned y 54 43 80 58 53 68 65 Send data to Excel The correlation coefficient for the data is r=1 and a=0.05. Should regression analysis be done? O The regression analysis should not be done. O The regression analysis should be done. Find the equation of the regression line. y'=a+bx b = Find y' when x= 65. y' =
Number of fires x 58 47 84 62 57 72 69 Number of acres burned y 54 43 80 58 53 68 65 Send data to Excel The correlation coefficient for the data is r=1 and a=0.05. Should regression analysis be done? O The regression analysis should not be done. O The regression analysis should be done. Find the equation of the regression line. y'=a+bx b = Find y' when x= 65. y' =

Chapter4: Linear Functions
Section4.3: Fitting Linear Models To Data
Problem 7SE: A regression was run to determine whether there is arelationship between the diameter of a tree (x,...

Related questions
Question
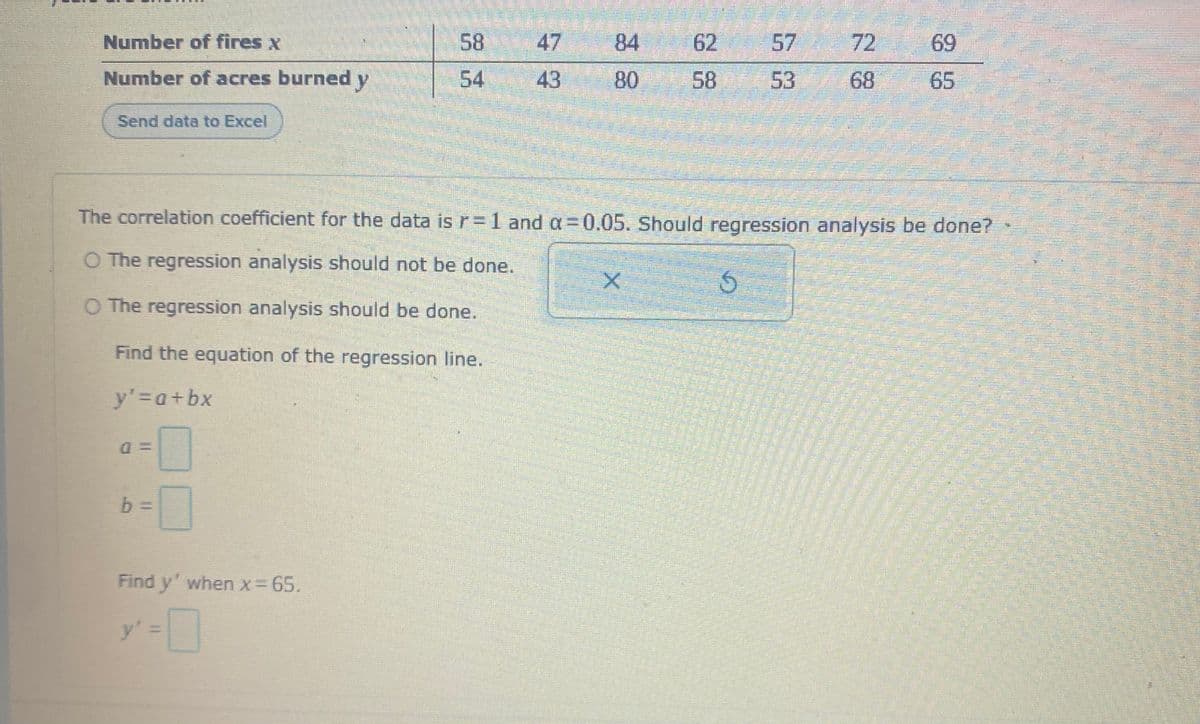
Transcribed Image Text:Number of fires x
58 47
84 62
57
72
69
Number of acres burned y
54
43
80
58
53
68
65
Send data to Excel
The correlation coefficient for the data is r=1 and a=D0,05. Should regression analysis be done?
O The regression analysis should not be done.
O The regression analysis should be done.
Find the equation of the regression line.
y'3Da+bx
Find y' when x= 65.
y'%3D
Expert Solution
This question has been solved!
Explore an expertly crafted, step-by-step solution for a thorough understanding of key concepts.

This is a popular solution!

Trending now
This is a popular solution!

Step by step
Solved in 2 steps with 6 images

Recommended textbooks for you

Functions and Change: A Modeling Approach to Coll…
Algebra
ISBN:
9781337111348
Author:
Bruce Crauder, Benny Evans, Alan Noell
Publisher:
Cengage Learning

Glencoe Algebra 1, Student Edition, 9780079039897…
Algebra
ISBN:
9780079039897
Author:
Carter
Publisher:
McGraw Hill
Functions and Change: A Modeling Approach to Coll…
Algebra
ISBN:
9781337111348
Author:
Bruce Crauder, Benny Evans, Alan Noell
Publisher:
Cengage Learning
Glencoe Algebra 1, Student Edition, 9780079039897…
Algebra
ISBN:
9780079039897
Author:
Carter
Publisher:
McGraw Hill

Algebra and Trigonometry (MindTap Course List)
Algebra
ISBN:
9781305071742
Author:
James Stewart, Lothar Redlin, Saleem Watson
Publisher:
Cengage Learning