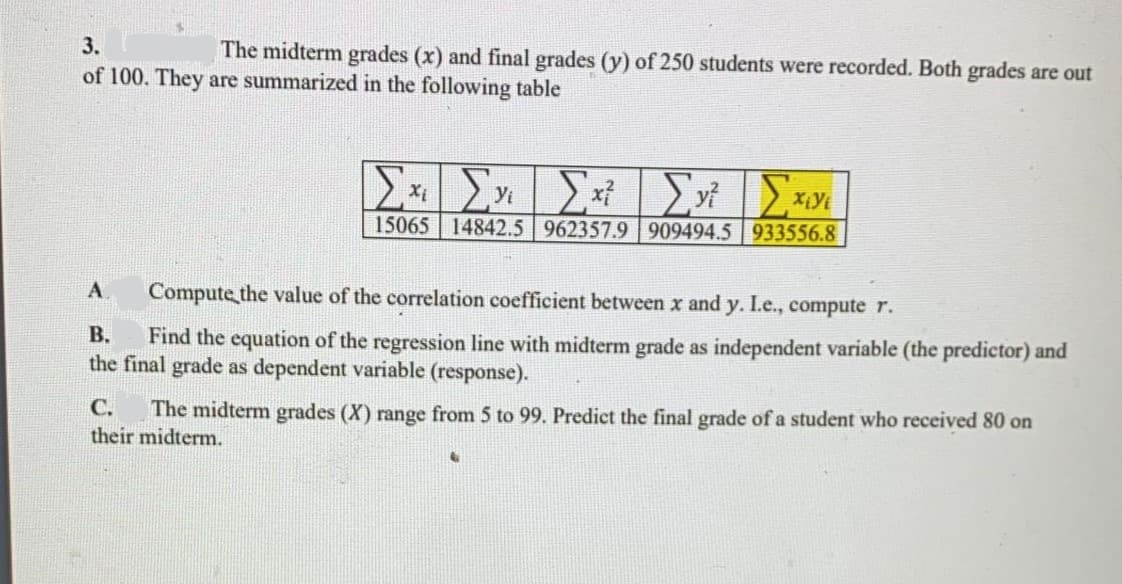
A Compute the value of the correlation coefficient between x and y. I.e., compute r. В. Find the equation of the regression line with midterm grade as independent variable (the predictor) and the final grade as dependent variable (response). С. The midterm grades (X) range from 5 to 99. Predict the final grade of a student who received 80 on their midterm.


Q: A sales manager collected the following data on annual sales for new customer accounts and the…
A: The independent variable is Years of experience. The dependent variable is Annual Sales. We have to…
Q: A researcher is going to conduct a regression line and created the following scatter plot that…
A: After visualizing this scatter plot we can say that, this points does not show linear pattern .…
Q: The following table gives information on the amount of sugar (in grams) and the calorie count in one…
A:
Q: A statistics professor wanted to know if there was a relationship between the midterm exam grade and…
A: Introduction - Correlation coefficients - Correlation coefficient are used to measure how strong a…
Q: If the coefficient of determination is 0.86 with corresponding regression line ˆy=2x+10, what is the…
A: Correlation: Correlation a measure which indicates the “go-togetherness” of two data sets. It can be…
Q: The following table gives the ages and blood pressure of 9 women. Age (X) : 56 42 36 47 49 42 60 72…
A: From given data, X Y X*Y X*X Y*Y 56 147 8232 3136 21609 42 125 5250 1764 15625 36 118 4248…
Q: A sales manager collected the following data on annual sales for new customer accounts and the…
A: y = 67.91+6.29x s = σ^ = 6.0862 ∑(x-x¯)2 = SSXX = 161.60 n = 10 X0 = 13 α=0.10
Q: Compute the value of the linear correlation coefficient for the data obtained in the study of the…
A: Σx=57 Σx2=579Σy=511 Σy2=38993Σxy=3745
Q: 5. Calculate the regression equation for the following data and also computes Karl Pearson's co-…
A: We have given that, No. Of students (X) :- 800, 600, 900, 700, 500, 400 No. Of passed (Y) :- 480,…
Q: A random sample of non-industrialized countries was selected and the life expectancy in years is…
A: Given: A random sample of non-industrialized countries was selected and the life expectancy in years…
Q: A researcher recorded the number of e-mails received in a month and the number of online purchases…
A: In this case, it is required to check whether the slope of the population regression line relating…
Q: A researcher is interested in the relationship between time spent browsing items in an online store…
A:
Q: in) Find the auto correlation function and its PSD. ) Find the Mean and Variance of Y (t)
A: Answer: For the given data
Q: Given that the correlation coefficient which relates length of the fish and PCB levels is r = 0.949,…
A: Linear regression is a way to model the relationship between two variables. The equation has the…
Q: The file P10 14V2.xlsx I includes data on the 50 top graduate programs in the United States,…
A: Given: SALARY OVERALL SCORE GMAT GPA 145987 100 720 3.2 135971 99 726 3.3 121544 93 710…
Q: predicted IQ of the twin born second, given that the twin born first has an IQ of 107? What does the…
A:
Q: Find the regression equation using the following set of data with y as the response variable. y 66.8…
A: Linear regression is one of the mathematical approaches to model the relationship between one or…
Q: Select a letter from the choices on the right into each of the drop-down boxes on the left.…
A: Given that ; Here we use statistical concept to identify the symbols.
Q: Assume that variables xx and yy have a significant correlation, and that the line of best fit has…
A: Given , The variables x and y have a significant correlation. The line of best fit is, ( Use…
Q: Calculate the co-efficient of correlation and the lines of regression for the following data: 1 2 3…
A: Given that X Y 1 9 2 8 3 10 4 12 5 11 6 13 7 14 8 16 9 15
Q: Below is a scatterplot showing preliminary exam and final exam scores for students in a secondary…
A: Explanation: Slope of simple linear regression: The slope of regression line shows the rate of…
Q: Show that the correlation coefficient between the residuals X2.13 is equal and opposite to that…
A:
Q: Are the years of education of a child dependent on the years of education of their parent? The table…
A: Followings are the Explanation of the question Calculate the linear Correlation Coefficient (r)…
Q: 1. What is the value of the correlation between Academic Performance and Digital Literacy? A.…
A: “Since you have posted a question with multiple sub-parts, we will solve first three sub-parts for…
Q: A researcher recorded the number of e-mails received in a month and the number of online purchases…
A: We are testing whether the slope is positive or not Therefore, it is a right tailed test
Q: Mr. James, president of Daniel-James Financial Services, believes that there is a relationship…
A: Table: X Y X2 Y2 XY 14 24 196 576 336 12 14 144 196 168 20 28 400 784 560 16 30 256 900…
Q: A set of n = 15 pairs of X and Y values has a correlation of r = +0.80 with SSY = 75, and the…
A: Given,sample size(n)=15correlation(r)=0.80SSY=75
Q: Find out the regression coeticients of Y on X and X on Y from the following data: ΣΧ= 50 , X= 5, Σ Υ…
A:
Q: A researcher is going to conduct a regression line and created the following scatter plot that…
A: In multiple linear regression, there will be more than one independent variable. In simple linear…
Q: The table below gives the list price and the number of bids received for five randomly selected…
A: Regression is a statistical method used in finance, investing, and other disciplines that attempts…
Q: Use least-squares regression to fit a straight line to х 6. 7 11 15 17 21 23 29 29 37 39 y 29 21 29…
A:
Q: Suppose two variables are under study are temperature in degrees Fahrenheit (y) and temperature in…
A: The given regression line is y=95x+32. The correlation coefficient is the ratio of the covariance…
Q: Assume that y is a function of three variables: X1, X2, and x3. If you run a regression of y on the…
A: Given information: The information about multiple linear regression is given.
Q: isted below are the overhead widths (in cm) of seals measured from photographs and the weights (in…
A: The Scatter diagram measures the relationship between two variable. On X-axis it represents the…
Q: A number of faculty and the number of students in a random selection of small colleges are shown.…
A:
Q: For the data given in the table below, find the linear correlation coefficient r and the…
A:
Q: A specialist in hospital administration stated that no. of employees in a hospital can be estimated…
A: Regression model: A regression model is required for the given data : The regression model can be…
Q: Find out the regression coefficients of Y on X and X on Y from the following data: ΣΧ= 50, X= 5 , Σ…
A: It is given that variance of X is 4 and the variance of Y is 9.
Q: The table lists the average monthly cost to workers for family health insurance for various years.…
A: NOTE: As per the guidelines, we are allowed to answer 1 question only. I am solving the question in…
Q: Indicate whether the following statements are true or false. Explain why and show your work. c) In…
A: In regression analysis, the problem of multicollinearity arises when one independent variable is…
Q: A departmental store has the following sales for a period of last one year of 8 salesmen, who have…
A: Correlation coefficient is the degree of correlation between two variables. And regression is a…
Q: A researcher collects data between the age in years, (x), of a movie theater's popcorn popper and…
A: As per guidelines we will solve first question only, please repost other questions for more answers.…
Q: The dataset below contains synthetic records of human heights and weights of 18 years old children.…
A: “Since you have asked multiple questions, we will solve the first question for you. If you want any…
Q: A study of the amount of rainfall and the quantity of air pollution removed produced the following…
A: Note, Since you have asked multiple question, we will solve the first question for you. If you want…
Q: A researcher collects data between the age in years, (x), of a movie theater's popcorn popper and…
A: Step: 1 Enter the data into the excel spreadsheet. Step: 2 Select the data and click on the Insert…
Q: Run a regression analysis on the following bivariate set of data with y as the response variable. y…
A: Given that
Q: Calculate the co-efficient of correlation and the lines of regression for the following data: 1 2 3…
A:
Q: A random sample of non-industrialized countries was selected, and the life expectancy in years is…
A: Men,x 59.7 72.9 41.9 46.2 50.3 43.2 Men,y 63.8 77.8 44.5 48.3 54 43.5
please do this urgently

Step by step
Solved in 3 steps with 1 images

- If a sample of 25 pairs of data yields a correlation coefficient, r, of 0.390 and the scatterplot displays a linear trend, can you use the regression equation to make predictions, assuming your x-values are within the domain of the data set? Choose your answer from the multiple choice answers below A.) Yes, because rcrit = 0.396 and the regression coefficient, r, is less than this value. B.) Yes, because rcrit = 0.381 and the regression coefficient, r, is greater than this value. C.) No, because rcrit = 0.381 and the regression coefficient, r, is greater than this value. D.) No, because rcrit = 0.396 and the regression coefficient, r, is less than this value.A set of n = 4 pairs of X and Y values has a Pearson correlation of r = 0.60 and SSY = 200. The standard error of estimate for the regression equation is _______. a. 8 points b. 10 points c. 6 points d. 4 pointsAssume that variables xx and yy have a significant correlation, and that the line of best fit has been calculated as ˆy=1.4x+3.6y^=1.4x+3.6. One observation is (9,16.3)(9,16.3).What is the predicted value of yy for the value x=9x=9? What is the residual for the value x=9x=9? What is the best interpretation for the residual? The value 16.316.3 is below the average value for yy when x=9x=9 The value 99 is above the average value for yy when y=16.3y=16.3 The value 16.316.3 is above the average value for yy when x=9x=9. The value 16.316.3 is below the average value for xx when y=16.3
- Here is a bivariate data set.x y71 461 555 6148 -876 3126 7074 -62 Find the correlation coefficient and report it accurate to four decimal places.r =A random sample of nonindustrialized countries was selected, and the life expectancy in years is listed for both men and women. Men 61.7 42.8 72.6 57.9 55.4 62.1 Women 50.4 74.2 75.3 75.4 49.1 65.2 The correlation coefficient for the data is =r−0.003 and =α0.05. Should regression analysis be done? Now Find the equation of the regression line. Round the coefficients to at least three decimal places. =y′+abx =a =b Now Find women's life expectancy in a country where men's life expectancy =60 years. Round your answer to at least three decimal places. Women's life expectancy is ____ years.The birth lengths in cm (x) and birth weights in kg (y) of a sample of 50 newborn female babies are compared, yielding a correlation coefficient of r=0.578 and a linear regression equation of ŷ =−8.89+0.243x The babies all had lengths between 46.5 and 53.0 cm, and weights between 2.50 and 4.05 kg. Based on this, predict the birth weight of a newborn female baby with a birth length of 48.5 cm.
- A sample of sunshine (x) in percent and temperature in O Fahrenheit (y) is recorded below to perform a linear regression test for whether or not correlation exists at α = .05. Assume test conditions are satisfied. x 28.6 32.1 35 31.6 28.6 30 26.6 33.2 24.2 31.3 y 75.4 91.3 86.9 90.7 85.8 88.3 72.5 86.4 70.7 89.4 What is the regression equation and what is the value of y^y^ when x = 25?Consider the following regression equation representing the linear relationship between the Canada Child Benefit provided for a married couple with 3 children under the age of 6, based on their annual family net income: ŷ =121.09−0.57246xR2=0.894 where y = annual Canada Child Benefit paid (in $100s) x = net annual family income (in $1000s) Source: Canada Revenue Agency a. As the net annual family income increases, does the Canada Child Benefit paid increase or decrease? Based on this, is the correlation between the two variables positive or negative?The Canada Child Benefit paid .The correlation between the two variables is .b. Calculate the correlation coefficient and determine if the relationship between the two variables is strong, moderate or weak.r= , the relationship is . Round to 3 decimal places c. Interpret the value of the slope as it relates to this relationship. For every $1 increase in annual family net income, there is a $0.57246 decrease in…Consider the following regression equation representing the linear relationship between the Canada Child Benefit provided for a married couple with 3 children under the age of 6, based on their annual family net income: ŷ =121.09−0.57246xR2=0.894 where y= annual Canada Child Benefit paid (in $100s) x = net annual family income (in $1000s) Source: Canada Revenue Agency a. As the net annual family income increases, does the Canada Child Benefit paid increase or decrease? Based on this, is the correlation between the two variables positive or negative?The Canada Child Benefit paid ? .The correlation between the two variables is ? .b. Calculate the correlation coefficient and determine if the relationship between the two variables is strong, moderate or weak.r= , the relationship is ? . Round to 3 decimal places c. Interpret the value of the slope as it relates to this relationship. For every $1 increase in annual family net income, there is a $0.57246 decrease in…
- Compute for the necessary correlational analysis based on the given data. The following data, adapted from Montgomery, Peck, and Vining (2001), present the number of certified mental defectives per 10,000 of estimated population in the United Kingdom ( y) and the number of radio receiver licenses issued (x) by the BBC (in millions) for the years 1924 through 1937. Fit a regression model relating y and x. Comment on the model. Specifically, does the existence of a strong correlation imply a cause-and-effect relationship?Given that the means of x and y are 64 and 66 , their standard deviations are 2.8 and 3.2 respectively and the coefficient of correlation between them is 0.5. 1) write down the regression lines.2. The following data, adapted from Montgomery, Peck, and Vining (2001), present the number of certified mental defectives per 10,000 of estimated population in the United Kingdom ( y) and the number of radio receiver licenses issued (x) by the BBC (in millions) for the years 1924 through 1937. Fit a regression model relating y and x. Comment on the model. Specifically, does the existence of a strong correlation imply a cause-and-effect relationship?