Number of items Number of customers 14-20 21-27 28-34 12 15 35-41 10 42-48


Q: Maths class 9 exercise 5.4 question number 8
A: Please share your question picture or details with us, so that we can solve.
Q: Number of children | Number of families 8 1 16 2 22 3 14 4 6 5 4 2
A:
Q: Class limits 10-20 21-31 32-42 43-53 54-64 65-75 Frequency 2 8 15 7 10 3
A: Find mode Mode=L+(f1-fo)/(2*f1-fo-f2)*h
Q: 1. Grade Point Averages The average undergraduate grade point average (GPA) for the 25 top-ranked…
A: Given data is…
Q: 00 %24 Contribution Margin and Contribution Margin Ratio For a recent year, Wicker Company-owned…
A: Given that, Total sales (Revenue) = $ 41000 million Expenses are following, Food and packaging = $…
Q: 3. The "Atkins Diet" is a diet where one eats predominantly protein and very few carbohydrates. A…
A: The following information has been given: The total number of students N =1000. The total number of…
Q: < I International representation in the Australian workforce between 1991 and 2031 75% 71.5% 70% 65%…
A:
Q: Average Number of Number of Production Employees A Employees B 61-65 2 3 66-70 8 7 71-75 11 12 76-80…
A: “Since you have posted a question with multiple sub-parts, we will solve first three subparts for…
Q: Population Land Area (sq. mile) United States 318,550,000 3.794,000 China 1,365,300,000 3,705,000…
A: answer is option iii.) explanation is given below
Q: Tire wear: An automobile manufacturer wants to compare the lifetimes of two brands of tires. She…
A: Suppose μd is the difference of mean lifetime o Brand A and Brand B tires.
Q: TV budget (1000 $) Radio budget (1000 $) Newspaper budget (1000 $) Sales Amount (1000 pieces) 240,1…
A: Given data, TV budget Radio budget Newspaper budget Sales Amount 240.1 16.7 22.9 15.9 248.8…
Q: Workers per Age Group (thousands) The table to the right gives the number of male and female workers…
A: Given that The table below shows the number of males and female workers earing Based on the tabel…
Q: Gender Job Experience Male Never had a part-time job 21 Had a part-time job during 15 summer only…
A: job experience gender male female total never had a part time job 21 31 52 never…
Q: Class boundaries Frequency 7.5-12.5 2 12.5-17.5 6 17.5-22.5 12 22.5-27.5 8 27.5-32.5 4
A: Given data: Total number of automobiles, N = 32 Class marks for the interval is calculated by the…
Q: 10,000 5,000 250 500 750 1,000 1,250 1,500 1,750 -5,000 Number of Hats Sold What is the minimum…
A: Given that :Graph of Profit vs Number of hats sold.
Q: Class Boundaries 7.5-12.5 12.5-17.5 Frequency 17.5-22.5 15 22.5-27.5 5 27.5-32.5
A:
Q: Ages Number of students 15-18 7 19-22 7 23-26 3 27-30 2 31-34 5 35-38 3
A: Given data, Relative frequency of Lower limit 33=?
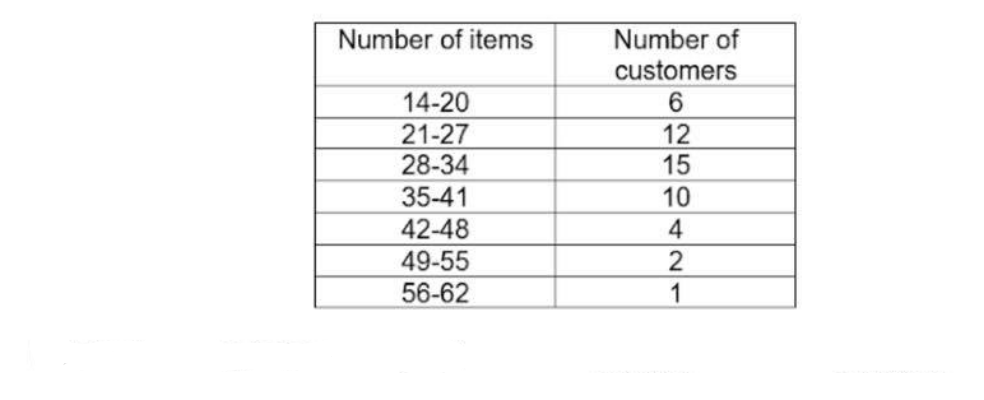
Q: Number of items Number of customers 14-20 21-27 28-34 12 15 35-41 10 42-48 4 49-55 2 56-62
A: To find: Below what value is the lower 60% Here, we have to find the 60th percentile value
Q: 12. Beginning inventory: 80 units at $14.50 s July: 50 units at $15.80 October: 70 units at $13.90…
A: Beginning inventory : 80 units at $14.50 1 unit at $14.5080 =…
Q: Simulations Door Number Sim. 1 1 2 3 1 2 2 1 3 1 2 4 1 2 5 2 1 6 1 2 7 1 2 8 2 1 9 1 0 2
A:
Q: Treatment I II III 8 n = 8 8. %3D %3| n SS = 35 SS = = 42 SS 70 || ||
A: Given, nI=8nII=8nIII=8SSI=35SSII=42SSIII=70 1. The variance of each sample is obtained as- For…
Q: Fint and classity the rehative extrema
A: Given: hx=ex3+x2 Differentiating hx with respect to x, h'x=ex3+x23x2+2x For critical points,…
Q: classes 4-6 6-8 6 8-10 20 10-12 14 12-14 Then X=.
A: From the provided information, Classes fi 4-6 7 6-8 6 8-10 20 10-12 14…
Q: ng and Sampling? a) Sampling. Represents a larger cluster than the sample. b) The sample…
A:
Q: Number of Cigarettes Smok 1-14 15-34
A: # wear seat belts dont wear seat belts total 0 188 160 348 1-14 27 23 50 15-34 41 34 75…
Q: a)How many indicator variables are required to dichotomize a nominal explanatory variable with five…
A: a)GivenThe nominal explanatory variable is with 5 categories. Here having four indicator variables…
Q: Sub-parts e-g
A: Given
Q: List three (3) types of Measures
A: a)Measures of Central Tendency:The measures commonly used are mean, median and mode. These measures…
Q: 7) Mark retired from competitive athletics last year. In his career as a sprinter, he had competed…
A:
Q: Frequency of Guests 100 - 109 60 110 119 75 120 - 129 130 - 139 140 - 149 14 What is the class…
A:
Q: Class limits Frequensy 13-19 タ 20-26 2タ-33 12 15 34-40 46-47 48-54 55-61 62-68 6. 2.
A: Given - Continuous frequency distribution with size of class = 6
Q: critical point of y : +3 х — 2 O 1,-1 O 3/2,-27/4 O 0,0 О 3, 27
A: Solution:Giveny=x3x-2Formula:uv'=vu'-uv'v2
Q: Destination 3 4 Supply 7 6 4 50 2 4 30 4 8 5 30 Demand 30 35 20 25 2. 3. 00 2. 3. 2. 1. 3. Source
A:
Q: Number of planets in other star systems near to the Vulcan system 16 4 3 2 5 7 8 6 9 14 12 10 8 1
A: The number of planets in the 50 star system is shown using bar graph
Q: Stem (hundred thousands) Leaf (ten thousands) 3 6,6,7,7,7,8,9,9,9 4 0,2,4,4,7,7,7,8,8,8,9,9,9,9 5…
A: Consider the stem and leaf problem given. While reading a stem and leaf plot the stem is the hundred…
Q: Scatterplots Scatterplot 1 Scatterplot 2 Scatterplo 8- -1- > -2- 2- -3- 04 -4- 0.2 0.4 0.6 0.8 1 0.2…
A:
Q: Number of Housing Permits 7.5+ 7- 6.5- 6- 4.5- 2003 2004 2005 2006 2007 2008 2009 Year Part: 0 / 5…
A: From the given graph. We solve this problem by using the given information.
Q: class frequency 20-24 25-29 8 30-34 13 35-39 22 40-44 9. 45-49 18
A: Given, class Frequency 20-24 2 25-29 8 30-34 13 35-39 22 40-44 9 45-49 18
Q: Scatterplot 1 Scatterplot 2 Scatterplot 3 8- 8- 6- 6- 6- AV 4- 4. 4- 2- 2- 2- 0- 0.2 0.4 0.6 0.8 0.2…
A: In the Scatter plot 1, we can see that the trend is linearly positive, the relationship is strongly…
Q: Pets again The local animal shelter in Exercise 18 re-ported that it currently has 24 dogs and 18…
A:
Q: Class limits Frequency 13-19 2 20-26 7 27-33 12 34-40 5 41-47 6. 48-54 1 55-61 62-68 2 What is the…
A: Note: Please repost 2nd question as i can answer only 1 question as per my policy. Class width…
Q: Scatterplot 1 Scatterplot 2 Scat 0- 15- 8- -2- 14- 6- 13- -4- 4- 12- •. -6- 2- 11- -8- 0+ 10+ 0.2…
A: Solution Scatter plot 1 r= -0.996 Scatter plot 2 r=0.387
Q: 1. Canadian federal income tax works on a graduated system, meaning the amount that you pay depends…
A:
Q: The stem-and-leaf plot above shows house sale prices over the last week in Cumberland. What was the…
A: In stem and leaf plot, whatever written in the left represents the ten's place digit of the numbers…
Q: Lower Class Limit Upper Class Limit Frequency 4 2 9 10 14 15 19 9 20 24 25 29 2 30 34 35 39 40 44 7…
A:
Q: 1. Vicious Cycle sells upscale bicycles and related equipment to professional bicycle riders and…
A: The company loses the same number yearly due to retirement and attrition.The company has a total of…
Q: First Year Fourth Year (X) 4 (Y) 5 6. 6. 10 10 9 10 4 2
A: Given data:
Q: Ages Number of personnel in a company (t) fxm 38-42 4 33-37 7. 28- 37 33- 27 10 18-22
A: Frequency of an observation is the number of times the observation is repeated in the data set which…
Q: Tire wear: An automobile manufacturer wants to compare the lifetimes of two brands of tires. She…
A: From the provided information, Sample size (n) = 7 Level of significance (α) = 0.01 The difference…
Q: Age Number (millions) 25-34 35-44 45-54 55-64 24.3 30.6 32.7 26.6
A: Given, Age Number 25-34 24.3 35-44 30.6 45-54 32.7 55-64 26.6
The lower 35% of the items is less than _________.

Step by step
Solved in 2 steps with 1 images
