Number of Housing Permits 7.5+ 7- 6.5- 6- 4.5- 2003 2004 2005 2006 2007 2008 2009 Year Part: 0 / 5 Part 1 of 5 (a) For which year was the number of permits greatest? Number (thousands)
Number of Housing Permits 7.5+ 7- 6.5- 6- 4.5- 2003 2004 2005 2006 2007 2008 2009 Year Part: 0 / 5 Part 1 of 5 (a) For which year was the number of permits greatest? Number (thousands)

Glencoe Algebra 1, Student Edition, 9780079039897, 0079039898, 2018
18th Edition
ISBN:9780079039897
Author:Carter
Publisher:Carter
Chapter10: Statistics
Section10.2: Representing Data
Problem 10PPS

Related questions
Question
100%
#13 help with 4 and 5
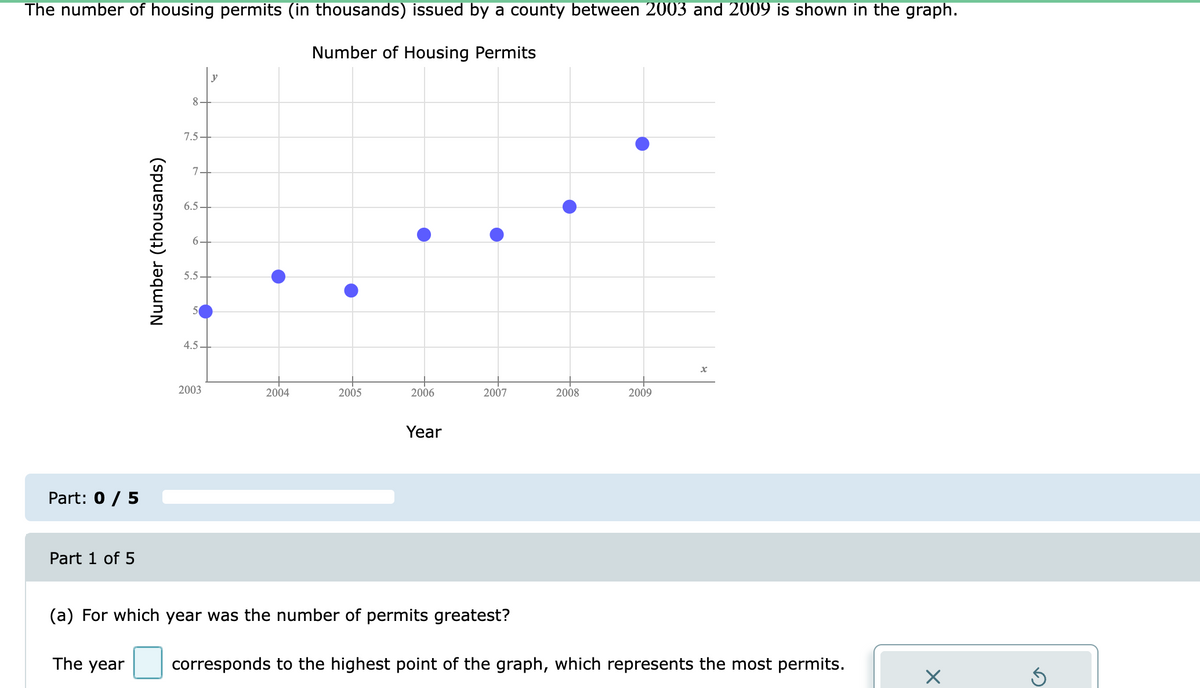
Transcribed Image Text:The number of housing permits (in thousands) issued by a county between 2003 and 2009 is shown in the graph.
Number of Housing Permits
y
8-
7.5-
7-
6.5
6.
5.5-
4.5-
2003
2004
2005
2006
2007
2008
2009
Year
Part: 0 / 5
Part 1 of 5
(a) For which year was the number of permits greatest?
The year
corresponds to the highest point of the graph, which represents the most permits.
Number (thousands)
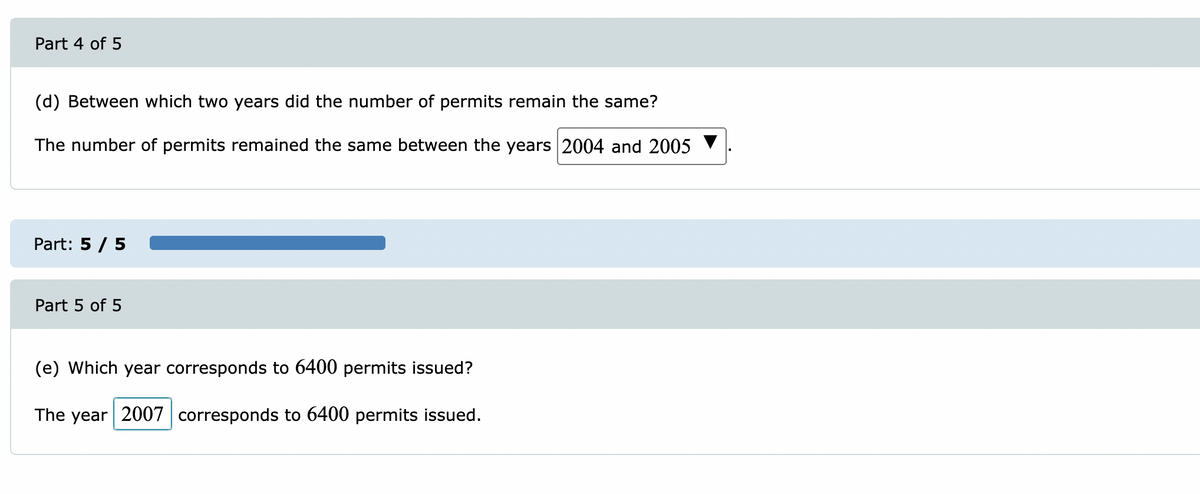
Transcribed Image Text:Part 4 of 5
(d) Between which two years did the number of permits remain the same?
The number of permits remained the same between the years 2004 and 2005
Part: 5 / 5
Part 5 of 5
(e) Which year corresponds to 6400 permits issued?
The year 2007 corresponds to 6400 permits issued.
Expert Solution
This question has been solved!
Explore an expertly crafted, step-by-step solution for a thorough understanding of key concepts.

This is a popular solution!

Trending now
This is a popular solution!

Step by step
Solved in 2 steps

Follow-up Questions
Read through expert solutions to related follow-up questions below.
Follow-up Question
A researcher wishes to determine whether the number of hours a person jogs per week is related to the person's age. Use a TI-83 Plus/TI-84 Plus calculator to construct the
| Age,
x
|
27
|
33
|
54
|
44
|
61
|
|---|---|---|---|---|---|
| Hours,
y
|
7.5
|
6
|
3
|
4.5
|
1
|
There appears to be a ________ linear relationship between a person's age and the number of hours a person jogs per week.
positive
negative or none
Solution
Recommended textbooks for you
Glencoe Algebra 1, Student Edition, 9780079039897…
Algebra
ISBN:
9780079039897
Author:
Carter
Publisher:
McGraw Hill

Algebra: Structure And Method, Book 1
Algebra
ISBN:
9780395977224
Author:
Richard G. Brown, Mary P. Dolciani, Robert H. Sorgenfrey, William L. Cole
Publisher:
McDougal Littell

Algebra & Trigonometry with Analytic Geometry
Algebra
ISBN:
9781133382119
Author:
Swokowski
Publisher:
Cengage
Glencoe Algebra 1, Student Edition, 9780079039897…
Algebra
ISBN:
9780079039897
Author:
Carter
Publisher:
McGraw Hill
Algebra: Structure And Method, Book 1
Algebra
ISBN:
9780395977224
Author:
Richard G. Brown, Mary P. Dolciani, Robert H. Sorgenfrey, William L. Cole
Publisher:
McDougal Littell
Algebra & Trigonometry with Analytic Geometry
Algebra
ISBN:
9781133382119
Author:
Swokowski
Publisher:
Cengage

College Algebra (MindTap Course List)
Algebra
ISBN:
9781305652231
Author:
R. David Gustafson, Jeff Hughes
Publisher:
Cengage Learning