Number of Teac ост 9 0 5.00 6.80 Is this distribution of teachers' shoe sizes at this school approximately Normal? Justify your answer based on the graph. 8.60 10.40 12.20 14.00 Shoe Size O Yes, this histogram is symmetric. O Yes, this histogram has only one peak. O No, this histogram is skewed left with one peak. O No, this histogram is skewed right with one peak. O No, this histogram has a center that is about size 9. Mark this and return Save and Exit Next Submit
Number of Teac ост 9 0 5.00 6.80 Is this distribution of teachers' shoe sizes at this school approximately Normal? Justify your answer based on the graph. 8.60 10.40 12.20 14.00 Shoe Size O Yes, this histogram is symmetric. O Yes, this histogram has only one peak. O No, this histogram is skewed left with one peak. O No, this histogram is skewed right with one peak. O No, this histogram has a center that is about size 9. Mark this and return Save and Exit Next Submit

MATLAB: An Introduction with Applications
6th Edition
ISBN:9781119256830
Author:Amos Gilat
Publisher:Amos Gilat
Chapter1: Starting With Matlab
Section: Chapter Questions
Problem 1P

Related questions
Question
Transcribed Image Text:EEEE
ост
15
Number of Teac
417
6.80
0
5.00
8.60 10.40 12.20 14.00
Shoe Size
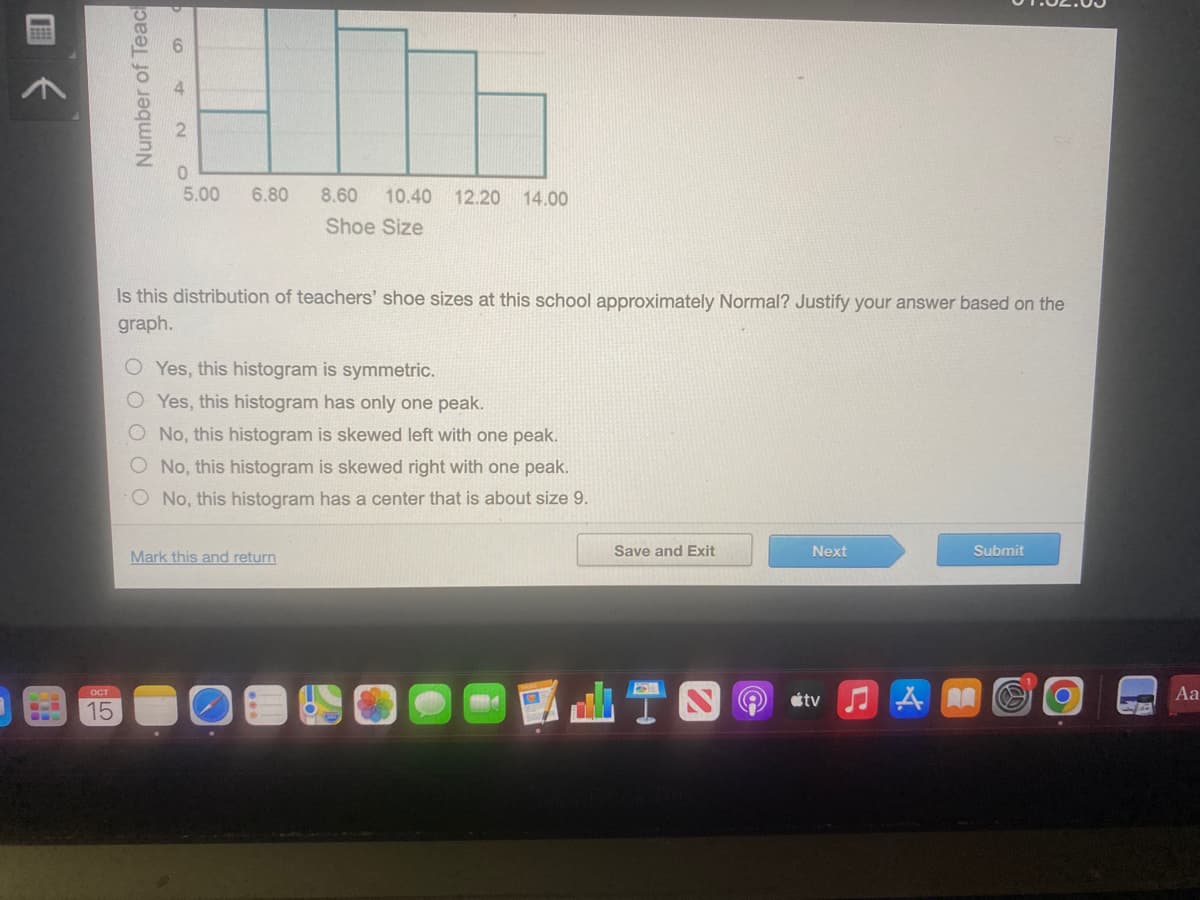
Is this distribution of teachers' shoe sizes at this school approximately Normal? Justify your answer based on the
graph.
OYes, this histogram is symmetric.
OYes, this histogram has only one peak.
No, this histogram is skewed left with one peak.
O No, this histogram is skewed right with one peak.
No, this histogram has a center that is about size 9.
Mark this and return
Save and Exit
Next
tv
♫M
Submit
-
Aa
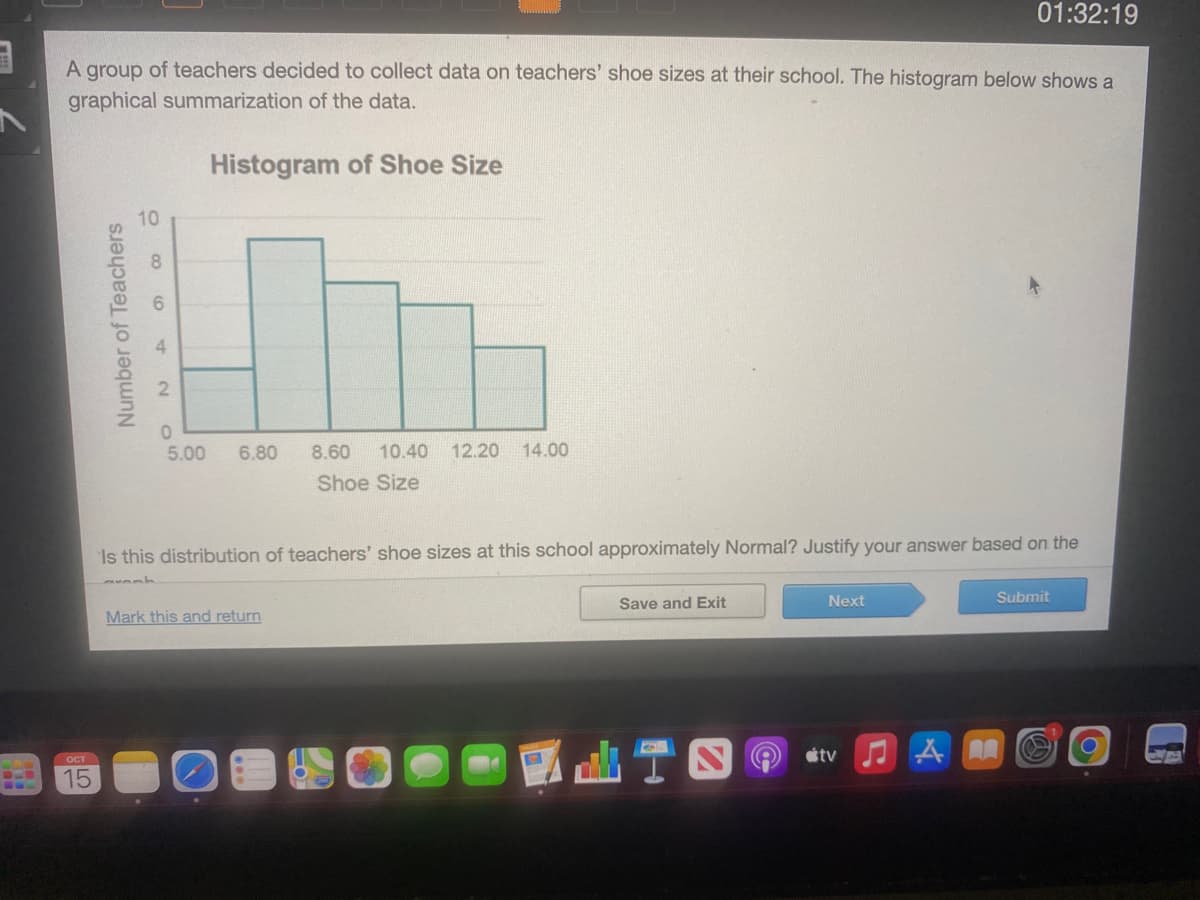
Transcribed Image Text:A group of teachers decided to collect data on teachers' shoe sizes at their school. The histogram below shows a
graphical summarization of the data.
Histogram of Shoe Size
ост
15
Number of Teachers
10
006
420
5.00
6.80 8.60 10.40 12.20 14.00
Shoe Size
Is this distribution of teachers' shoe sizes at this school approximately Normal? Justify your answer based on the
Mark this and return
Save and Exit
01:32:19
Next
tv ♫AR
Submit
O
A
Expert Solution
This question has been solved!
Explore an expertly crafted, step-by-step solution for a thorough understanding of key concepts.

Step by step
Solved in 2 steps

Recommended textbooks for you
MATLAB: An Introduction with Applications
Statistics
ISBN:
9781119256830
Author:
Amos Gilat
Publisher:
John Wiley & Sons Inc

Probability and Statistics for Engineering and th…
Statistics
ISBN:
9781305251809
Author:
Jay L. Devore
Publisher:
Cengage Learning

Statistics for The Behavioral Sciences (MindTap C…
Statistics
ISBN:
9781305504912
Author:
Frederick J Gravetter, Larry B. Wallnau
Publisher:
Cengage Learning
MATLAB: An Introduction with Applications
Statistics
ISBN:
9781119256830
Author:
Amos Gilat
Publisher:
John Wiley & Sons Inc
Probability and Statistics for Engineering and th…
Statistics
ISBN:
9781305251809
Author:
Jay L. Devore
Publisher:
Cengage Learning
Statistics for The Behavioral Sciences (MindTap C…
Statistics
ISBN:
9781305504912
Author:
Frederick J Gravetter, Larry B. Wallnau
Publisher:
Cengage Learning

Elementary Statistics: Picturing the World (7th E…
Statistics
ISBN:
9780134683416
Author:
Ron Larson, Betsy Farber
Publisher:
PEARSON

The Basic Practice of Statistics
Statistics
ISBN:
9781319042578
Author:
David S. Moore, William I. Notz, Michael A. Fligner
Publisher:
W. H. Freeman

Introduction to the Practice of Statistics
Statistics
ISBN:
9781319013387
Author:
David S. Moore, George P. McCabe, Bruce A. Craig
Publisher:
W. H. Freeman