O A. No. The correlation between the expected z-scores and the observed data, does not exceed the critical value, Therefore, it is reasonable to conclude that the data come from a normal population. O B. Yes. The correlation between the expected z-scores and the observed data, that the data come from a normal population. exceeds the critical value, Therefore, it is not reasonable to conclude O C. No. The correlation between the expected z-scores and the observed data, does not exceed the critical value, Therefore, it is not reasonable to conclude that the data come from a normal population. O D. Yes. The correlation between the expected z-scores and the observed data, that the data come from a normal population. exceeds the critical value, Therefore, it is reasonable to conclude
O A. No. The correlation between the expected z-scores and the observed data, does not exceed the critical value, Therefore, it is reasonable to conclude that the data come from a normal population. O B. Yes. The correlation between the expected z-scores and the observed data, that the data come from a normal population. exceeds the critical value, Therefore, it is not reasonable to conclude O C. No. The correlation between the expected z-scores and the observed data, does not exceed the critical value, Therefore, it is not reasonable to conclude that the data come from a normal population. O D. Yes. The correlation between the expected z-scores and the observed data, that the data come from a normal population. exceeds the critical value, Therefore, it is reasonable to conclude

MATLAB: An Introduction with Applications
6th Edition
ISBN:9781119256830
Author:Amos Gilat
Publisher:Amos Gilat
Chapter1: Starting With Matlab
Section: Chapter Questions
Problem 1P

Related questions
Question
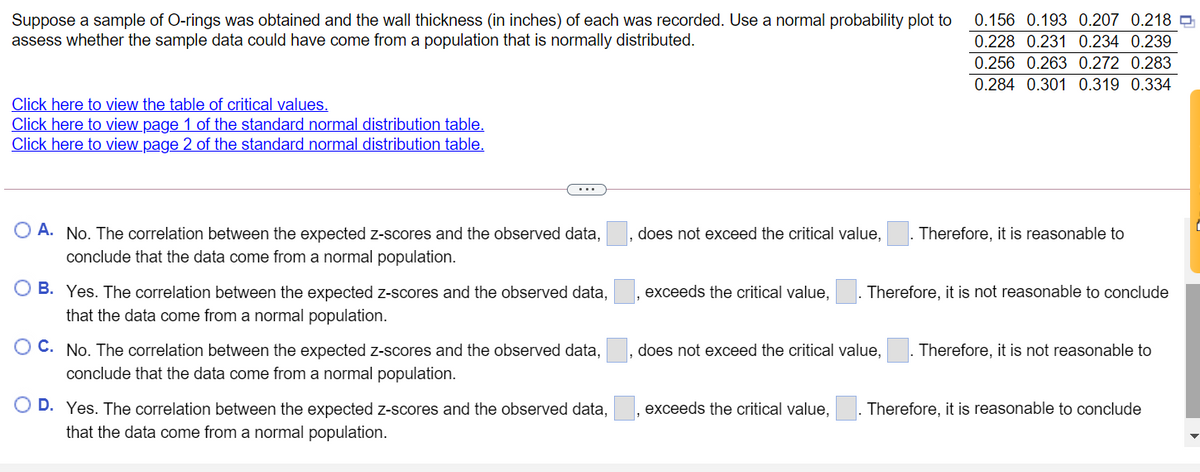
Transcribed Image Text:Suppose a sample of O-rings was obtained and the wall thickness (in inches) of each was recorded. Use a normal probability plot to
assess whether the sample data could have come from a population that is normally distributed.
0.156 0.193 0.207 0.218 O
0.228 0.231 0.234 0.239
0.256 0.263 0.272 0.283
0.284 0.301 0.319 0.334
Click here to view the table of critical values.
Click here to view page 1 of the standard normal distribution table.
Click here to view page 2 of the standard normal distribution table.
O A. No. The correlation between the expected z-scores and the observed data,
conclude that the data come from a normal population.
does not exceed the critical value,
Therefore, it is reasonable to
O B. Yes. The correlation between the expected z-scores and the observed data,
that the data come from a normal population.
exceeds the critical value,
Therefore, it is not reasonable to conclude
O C. No. The correlation between the expected z-scores and the observed data,
does not exceed the critical value,
Therefore, it is not reasonable to
conclude that the data come from a normal population.
O D. Yes. The correlation between the expected z-scores and the observed data,
that the data come from a normal population.
exceeds the critical value,
Therefore, it is reasonable to conclude
Expert Solution
This question has been solved!
Explore an expertly crafted, step-by-step solution for a thorough understanding of key concepts.

This is a popular solution!

Trending now
This is a popular solution!

Step by step
Solved in 4 steps with 1 images

Recommended textbooks for you
MATLAB: An Introduction with Applications
Statistics
ISBN:
9781119256830
Author:
Amos Gilat
Publisher:
John Wiley & Sons Inc

Probability and Statistics for Engineering and th…
Statistics
ISBN:
9781305251809
Author:
Jay L. Devore
Publisher:
Cengage Learning

Statistics for The Behavioral Sciences (MindTap C…
Statistics
ISBN:
9781305504912
Author:
Frederick J Gravetter, Larry B. Wallnau
Publisher:
Cengage Learning
MATLAB: An Introduction with Applications
Statistics
ISBN:
9781119256830
Author:
Amos Gilat
Publisher:
John Wiley & Sons Inc
Probability and Statistics for Engineering and th…
Statistics
ISBN:
9781305251809
Author:
Jay L. Devore
Publisher:
Cengage Learning
Statistics for The Behavioral Sciences (MindTap C…
Statistics
ISBN:
9781305504912
Author:
Frederick J Gravetter, Larry B. Wallnau
Publisher:
Cengage Learning

Elementary Statistics: Picturing the World (7th E…
Statistics
ISBN:
9780134683416
Author:
Ron Larson, Betsy Farber
Publisher:
PEARSON

The Basic Practice of Statistics
Statistics
ISBN:
9781319042578
Author:
David S. Moore, William I. Notz, Michael A. Fligner
Publisher:
W. H. Freeman

Introduction to the Practice of Statistics
Statistics
ISBN:
9781319013387
Author:
David S. Moore, George P. McCabe, Bruce A. Craig
Publisher:
W. H. Freeman