O ANOVA Compare anxiety across 3 time-points. Assume a within subjects design. Calculate F values 1 2 3 4 1 22 31 20 23 Anxiety Anxiety 2 3 38 40 32 33 42 50 43 37
O ANOVA Compare anxiety across 3 time-points. Assume a within subjects design. Calculate F values 1 2 3 4 1 22 31 20 23 Anxiety Anxiety 2 3 38 40 32 33 42 50 43 37

MATLAB: An Introduction with Applications
6th Edition
ISBN:9781119256830
Author:Amos Gilat
Publisher:Amos Gilat
Chapter1: Starting With Matlab
Section: Chapter Questions
Problem 1P

Related questions
Question
-What is the DF between and DF within?
-if a
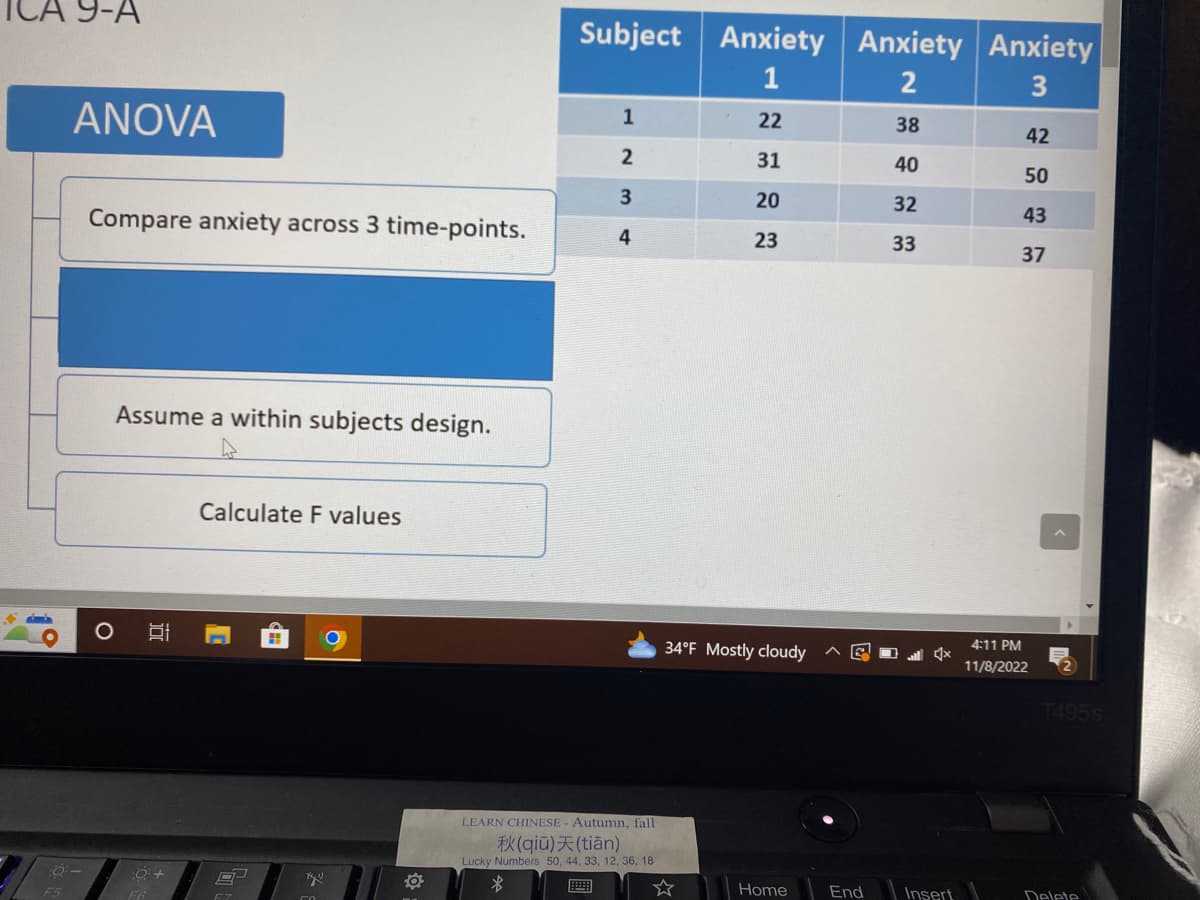
Transcribed Image Text:9-A
F5
ANOVA
:8:-
Compare anxiety across 3 time-points.
O
Assume a within subjects design.
밥
:0 +
F6
Calculate F values
C
L
8
CH
Xy
O
Subject
1
2
3
4
LEARN CHINESE - Autumn, fall
X(qiu) (tian)
Lucky Numbers 50, 44, 33, 12, 36, 18
$
Anxiety Anxiety Anxiety
1
2
3
22
38
31
40
20
32
23
33
34°F Mostly cloudy
Home
End
x
Insert
42
50
43
37
4:11 PM
11/8/2022
T495S
Delete
Expert Solution
This question has been solved!
Explore an expertly crafted, step-by-step solution for a thorough understanding of key concepts.

Step by step
Solved in 2 steps

Recommended textbooks for you
MATLAB: An Introduction with Applications
Statistics
ISBN:
9781119256830
Author:
Amos Gilat
Publisher:
John Wiley & Sons Inc

Probability and Statistics for Engineering and th…
Statistics
ISBN:
9781305251809
Author:
Jay L. Devore
Publisher:
Cengage Learning

Statistics for The Behavioral Sciences (MindTap C…
Statistics
ISBN:
9781305504912
Author:
Frederick J Gravetter, Larry B. Wallnau
Publisher:
Cengage Learning
MATLAB: An Introduction with Applications
Statistics
ISBN:
9781119256830
Author:
Amos Gilat
Publisher:
John Wiley & Sons Inc
Probability and Statistics for Engineering and th…
Statistics
ISBN:
9781305251809
Author:
Jay L. Devore
Publisher:
Cengage Learning
Statistics for The Behavioral Sciences (MindTap C…
Statistics
ISBN:
9781305504912
Author:
Frederick J Gravetter, Larry B. Wallnau
Publisher:
Cengage Learning

Elementary Statistics: Picturing the World (7th E…
Statistics
ISBN:
9780134683416
Author:
Ron Larson, Betsy Farber
Publisher:
PEARSON

The Basic Practice of Statistics
Statistics
ISBN:
9781319042578
Author:
David S. Moore, William I. Notz, Michael A. Fligner
Publisher:
W. H. Freeman

Introduction to the Practice of Statistics
Statistics
ISBN:
9781319013387
Author:
David S. Moore, George P. McCabe, Bruce A. Craig
Publisher:
W. H. Freeman