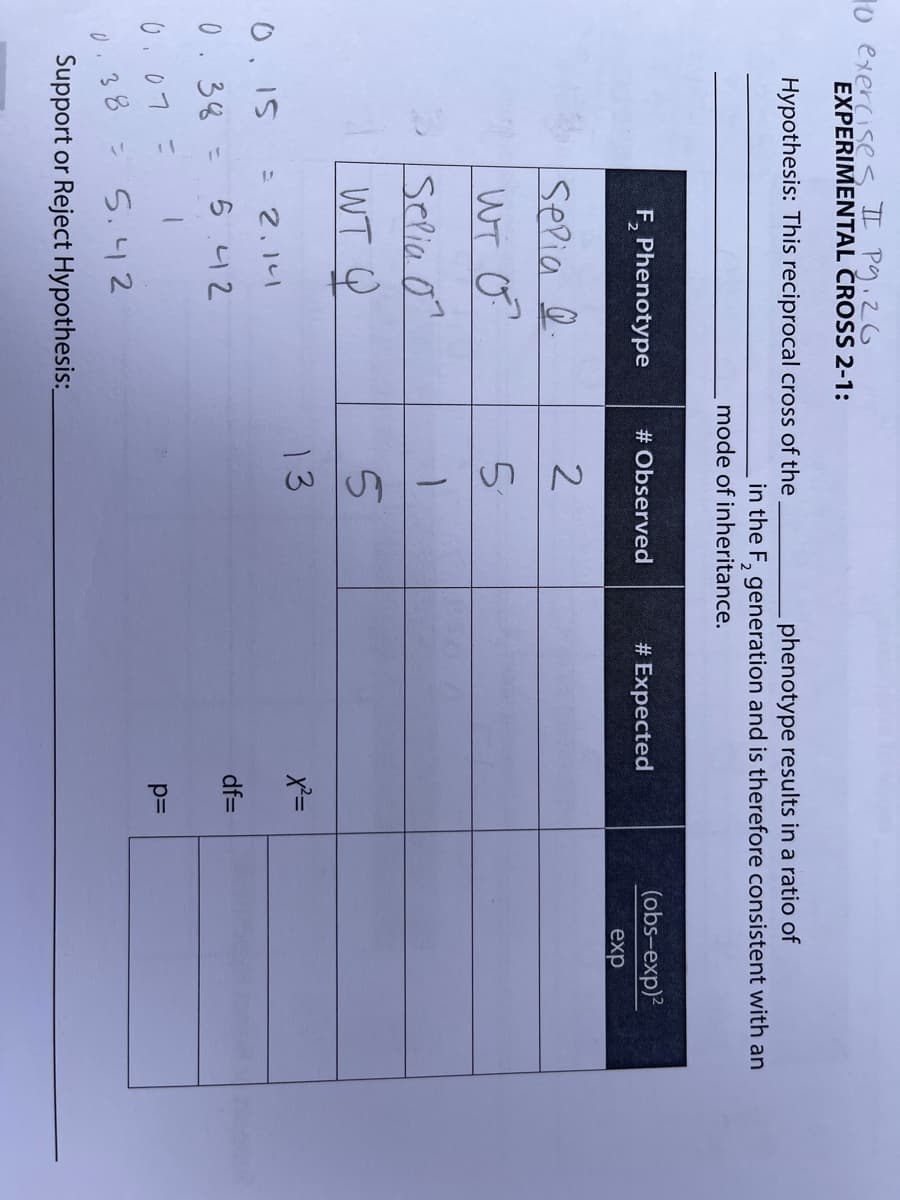
o exercises II Pg.2G EXPERIMENTAL CROSS 2-1: Hypothesis: This reciprocal cross of the phenotype results in a ratio of in the F, generation and is therefore consistent with an mode of inheritance. F, Phenotype # Observed # Expected (obs-exp)? exp Sepia e 2 WT o Selia o WT Q 13 2.14 0.38 5.42 df= %3D 0.07 = .38 5.42 Support or Reject Hypothesis:


Q: Suppose observations yt follow a linear trend + white noise stochastic process: Yt = c + ßt + €+t E4…
A: Given yt=c+βt+εt , where εt~WN0, σ2
Q: We want to test the relative efficacy of a new cholesterol lowering lrug A versus existing drug B.…
A: 1. The distribution of the difference in the sample means, ∆^=Y¯A-Y¯B: Consider, the mean of…
Q: Consider a model with an interaction term between being female and being married. The dependent…
A: Given information:- Coefficient of interaction term=0.301Standard error of interaction…
Q: Use alpha of 0.05 2 tail. Free Association (in seconds) Partially Controlled (in seconds)…
A: “Since you have posted a question with multiple sub-parts, we will solve the first three subparts…
Q: Factor A: F= (2,11) 4.95 Factor B: F= (2, 11) 4.95 interaction A and B: F= (2,11) 2.11 At an…
A: ANOVA is used to measure the mean significant difference between the three or more groups. If there…
Q: Omega-3, finis Exercises 21 and 23 describe an experi-ment investigating the effectiveness of…
A:
Q: Ql: Consider regression model Y,= B + B2X½+ B3X3, +U,with hypothetical data Evx, = 50, Eri = 20, =…
A: The confidence interval calculated using the values sample statistic or population parameter,…
Q: Consider the regression Y = a, + az X + a; Z+u. we know that if there is a strong linear correlation…
A: Given statement, 'if there is a strong linear correlation between X and Z then it is more likely…
Q: A psychologist is studying the relationship between self-esteem scores (X) and job satisfaction…
A: By using the regression equation to solve this problem Ycap = a + b × X
Q: Show work done, no excel. x 35 45 52 66 76 81 y 1 4 10 20 26 39 Determine the…
A: Hii ! Thanks for posting the question . Since your question has more than three subparts , we have…
Q: A researcher designs an experiment using two drugs, she prepares 15 independent flasks of yeast…
A: Assumptions of One-way ANOVA: i) Each sample is taken from the normally distributed population. ii)…
Q: Supposed that you were asked to examine the relationship between the height of children and their…
A: The test statistic is given as- t=estimate/standard error For slope, t=0.73/0.10=7.3 For intercept,…
Q: Clearly describe the advantages of portfolio diversification. Suppose, the rates of return on two…
A: Portfolio Diversification Portfolio Diversification is the process of investing your money in…
Q: 1. Explain how can test the joint hypothesis that ? 2 = ? 3 = 0 related to average income 2.…
A: 1 ) Explain how you can test the joint hypothesis that B2 = B3 = 0 related to average income per…
Q: 2. The grams of solids removed from a material (y) is thought to be related to the drying time. Ten…
A: We have given data, 4.3, 1.5, 1.8, 4.9, 4.2, 4.8, 5.8, 6.2, 7.0, 7.9 2.5, 3.0, 3.5, 4.0, 4.5, 5.0,…
Q: 4. Yield of potato resulting from use of different fertilizer (A, B, C, D, E) from CRD experiment…
A:
Q: Consider a stationary AR(2) process. (i) Write down the model with a constant term; (ii) Derive the…
A: Hello! As you have posted more than 3 sub parts, we are answering the first 3 sub-parts. In case…
Q: Test for differences (a) between ovalbumin-sensitized and nonser chree different exposures, and (c)…
A: Arrange the data in tabular form: Acetaldehyde Air Benzaldehyde No 49.9 24.15 31.1 No 50.6…
Q: You have the blow metrics for a model: TP = 40, TN = 45, FP = 7, FN = 8. The cost associated with…
A: @solution:::: thank you for asking this question.
Q: Data is collected on teacher salary (measured in 1000’s of $’s) and years of service, rating by the…
A: Given Data is collected on teacher salary (measured in 1000’s of $’s) and years of service, rating…
Q: Consider the standard simple regression model y = Bo + Bix + u under standard assumptions The usual…
A: Hi! Thank you for the question, As per the honor code, we are allowed to answer three sub-parts at a…
Q: We want to test the relative efficacy of a new cholesterol lowering lrug A versus existing drug B.…
A: 1.
Q: Consider the regression Y = a, + az X+ azZ +u. we know that if there is a strong linear correlation…
A: It is stated that " if there is a strong correlation between X and Z then it is more likely that the…
Q: 13.26. Question attached. Thank you for answering my question!
A: McNemar's test can be used to determine whether the rate of DKA is same before and after therapy.…
Q: 2. Hyperlipidemia in children has been hypothesized to be related to high cholesterol in their…
A:
Q: • Model 1 = Y; = Bo + B1Xli+ E;; • Model 2 Y; = Bo + B2x2i + Ej • Model 3 Y; = Bo + B1xli + B2x2i +…
A: Since we only answer up to 3 sub-parts, we’ll answer the first 3. Please resubmit the question and…
Q: Table 4 Blood type Types of Vaccine A B AB Sinovac 50 M 50 20 AstraZeneca 30 20 20 Complete Table 4…
A: i) There is total 250 citizens.
Q: 7.57 Oxygen bubble velocity in a purification process. Refer to m the Chemical Engineering Research…
A: Answer :
Q: 2. An experiment is done to investigate the impact of glass type and phosphor type on the brightness…
A: Given data, Response variable : Brightness level of television tube
Q: Correlated t tests almost always have greater power than independent t tests. Explain this?
A: If the standard error for the difference between means is smaller, this provides the larger t value.
Q: correlation is then given by 8XY rXY 8x8Y nd sy are the sample standard deviations of X and Y,…
A: *answer:
Q: The heights of a sample of 10 fathers and their eldest sons are given below : Height of fathers (X)…
A: Here, Height given for 10 samples of father and son. We have to calculate regression equation,…
Q: bright red pigment which has been shown to have powerful antioxidant and anticarcinogenic…
A: We have given that Sample size n =36 Sample mean = 13.1 Standard deviation=1.2
Q: A track coach is trying to decide whether to recommend a new running shoe by Converse or his…
A: Assumptions for paired sample t–test: The selected samples are simple random sample. Each…
Q: 10-84. O An article in Knee Surgery, Sports Traumatology, Arthroscopy (2005, Vol. 13, pp. 273–279)…
A: In order to determine whether the success rate for longer tears is greater than that if shorter…
Q: Suppose the variance of a regression model's stochastic error term is given by: Var(e) = o = 2.5, i=…
A: Given that The variance of a regression model stochastic error is given We have choose the correct…
Q: 2. Casuarina equisetifolia (Australian pine) is allelopathic, but some studies have found that C.…
A: One way ANOVA : One way ANOVA is a hypothesis testing testing in which three or more than three…
Q: b) Suppose you are given the following information for an OLS regression: Σxivi: Xi Yi 830102, T =…
A: Since you have posted a question with multiple sub-parts, we will solve the first three sub-parts…
Q: A very large study showed that aspirin reduced the rate of first heart attacks by 33%. A…
A: a) Null and alternative hypotheses: The hypothesis which is tentatively fixed up under and tested…
Q: Let "Var" stand for variance. Further, let be the stochastic error term for observation i for…
A:
Q: You run a regression analysis on a bivariate set of data (n = 52). With a = 52.2 and j = 24.1, you…
A: The provided data is, The regression equation is,
Q: 1. Mark is an electronics engineer and is curious about the impact on tube conductivity of three…
A: Anova is a type of parametric test. It is the extension of the two sample t test. In anova we…
Q: Consider the simple regression model y, = Bo + B1r, + e, i = 1,.., n with e,~ N(0, a). The es are…
A: Simple linear regression model: A simple linear regression model is given as y = b0 + bx, where y is…
Q: 86 Shaft graves in ancient Greece. Refer to the American O Journal of Archaeology (Jan. 2014) study…
A:
Q: The data below represent the memberships of players in squid game during the past 6 weeks. Use…
A: Given: Let Week be denoted as x and Number of players be denoted as y. x (Week) y (Players) 1…
Q: 3.ln an experiment, the experimenters were interested in the effect of fertilizer, species and their…
A: ANOVA table Set hypothesis : for interaction There is significance no difference between Fertilizer…
Q: Now complete the chi-square test to determine if the Hardy-Weinberg equilibrium has been violated,…
A: Null hypothesis: there is no significant difference between observed and expected frequencies. sum…
Q: 10-84. + An article in Knee Surgery, Sports Traumatology, Arthroscopy (2005, Vol. 13, pp. 273–279)…
A: a) Consider that p1, p2 is the true success rate for tears greater than 25 millimeters and shorter…
Q: 10-84. O An article in Knee Surgery, Sports Traumatology, Arthroscopy (2005, Vol. 13, pp. 273–279)…
A: 10-84. The data shows the arthroscopic meniscal repair with an absorbable screw showed that for…
Q: State wh 362 The iegree of treedom of t-test for independent samples (where oy & oz are unknown and…
A: Given data, n1=37 n2=43 Given df=79

Step by step
Solved in 2 steps with 1 images

- Two Factor ANOVA How do i fill in the missing values on the chart and find out if the interaction is significant?When the correlation coefficient (r) is zero, we can say: Choose one: a. the variables are not related B. the regression line fit is perfect C. the regression line is horizontal D. the variables are not linearly relatedDetermine whether the results appear to have statistical significance, and also determine whether the results appear to have practical significance. One of a botanist's hybridization experiments with peas yielded 500 offspring with 130 of those peas (or 2 %) having yellow pods. According to genetic theory, 25% of the offspring peas should have yellow pods. Question content area bottom Part 1 Does the result have statistical significance? According to genetic theory, (how many?) of the 500 peas would have yellow pods. The difference between the actual number of peas with yellow pods and the expected number of peas with yellow pods is enter your response here pea(s). This difference does? or does not? appear to be statistically significant. (Type whole numbers.)
- r. Lyte wishes to study speed of Reaction Time to press a button in response to the onset of a lamp. The independent variable (IV) is the color of the light produced by the lamp (red, orange, yellow, green, or blue). Since only 10 participants are available, she elects to administer the IV within-subjects with all 10 participants being exposed to all five levels of the color variable. The order of the color of the light presentation is to be counterbalanced. Using concepts from the textbook, why would Dr. Lyte need to use counterbalancing in this scenario?Testing the Effects of Tea on the Immune SystemWe have seen that drinking tea appears to offer a strong boost to the immune system. In a study extending the results,1 blood samples were taken on 5 participants before and after one week of drinking about five cups of tea a day (the participants did not drink tea before the study started). The before and after blood samples were exposed to e.coli bacteria, and production of interferon gamma, a molecule that fights bacteria, viruses, and tumors, was measured. Mean production went from 155 pg/mL before tea drinking to 448 pg/mL after tea drinking. The mean difference for the 5 subjects is 293 pg/mL with a standard deviation in the differences of 242. The paper implies that the use of the t-distribution is appropriate.Use the information to test whether mean production of interferon gamma as a response to bacteria is significantly higher after drinking tea than before drinking tea. Use a 5% significance level.1Adapted from Kamath, A., et.…The mango is considered the "king of fruits" in many parts of the world. Mangoes are generally harvested at the mature green stage and ripen up during the marketing process of transport, storage, and so on. During this process, about 30% of the fruit is wasted. Because of this, the impact of harvest stage and storage conditions on the postharvest quality are of interest. In this experiment, the fruit was harvested at 80, 95, or 110 days after the fruit setting (the transition from flower to fruit) and then stored at temperatures of 20∘C, 30∘C, or 40∘C. For each harvest time and storage temperature, a random sample of mangoes was selected, and the time to ripening was measured. What are the factors, the treatments, and the response variables? Take each item from the answer bank and place into the appropriate category.
- statistics teacher realize that his students keep using cell phones during the class. Then he did some research and found out that people use cell phones for 7.2 hours per day on average in turkey, and usasge time variability around that average is 2,0449. Then he decides to give an assignment of reading books as an alternative of cell phone usage in exchange of 50 extra credit to thir statistics examç After the exam, he collecte3d the data of cell phone usage time from his 127 students and calculated the average cell phone usage time drops to 6.8 hours per day. Under the assumption that probability of uncontrolled factors leading you the wrong statistical decision is five percent, conduct the statistical analysis to decide whether decrease in the cell phone usage time is real or it happens just because of the randım chance and interpret the resulsts.Studies have found that people find symmetrical faces more attractive than faces that are not symmetrical. To test this theory, a psychiatrist selected a random sample of people and showed them pictures of three different faces: a face that is perfectly symmetrical, a face that is slightly asymmetrical, and a face that is highly asymmetrical. She then asked them to rate the three faces in terms of their attractiveness on a scale from 1 to 7, with 7 being the most attractive. Test the null hypothesis that attractiveness does not differ with facial symmetry.Aviation and high altitude physiology is a specialty in the study of medicine. Let x= partial pressure of oxygen in the alveoli when breathing naturally available air. Let y= Partial pressure when breathing pure oxygen. The (x,y) that appears corresponding to elevations from 10,000 feet to 30,000 feet and 5000 foot intervals for a random sample volunteers. Although the medical data were collected using airplanes, they apply equally to mount Everest climbers (summit 20,028 feet) x 7.5 4.7 4.2 3.3 2.1 (units: mm hg\10) y 43.8 32.3 26.2 16.2 13.9 (units: mm hg\10) Σx=21.8 Σy=132.4 Σx2=111.28 Σy2= 4103.82 Σxy=673 r=.972 use a 5% level of significance to test the claim that p>0. (Use 2 decimal places) t= critical t= Se=3.3276 a=.765 b=5.898 find the predicted pressure when breathing pure oxygen for the pressure from breathing available air is x=2.5.(use two decimal places) find a 99% confidence interval for y when x=2.5.(use 1 decimal place) lower limit= upper limit=he was a 5%…
- Peter is conducting an experiment to determine whether a new medication is effective in reducing swelling. He gets 1,500 volunteers with swelling and divides them into two groups. The control group does not receive any medication; the treatment group receives the medicationThe patients in the treatment group show reduced signs of swelling. What can Peter conclude from this experiment?The least-squares regression equation is y=784.6x+12,431 where y is the median income and x is the percentage of 25 years and older with at least a bachelor's degree in the region. The scatter diagram indicates a linear relation between the two variables with a correlation coefficient of 0.7962. In a particular region, 26.5 percent of adults 25 years and older have at least a bachelor's degree. The median income in this region is $29,889. Is this income higher or lower than what you would expect? Why?The least-squares regression equation is y=728.0x+14,705 where y is the median income and x is the percentage of 25 years and older with at least a bachelor's degree in the region. The scatter diagram indicates a linear relation between the two variables with a correlation coefficient of 0.8165. For every dollar increase in median income, the percent of adults having at least a bachelor's degree is ___%, on average. For a median income of $0, the percent of adults with a bachelor's degree is ____%.
