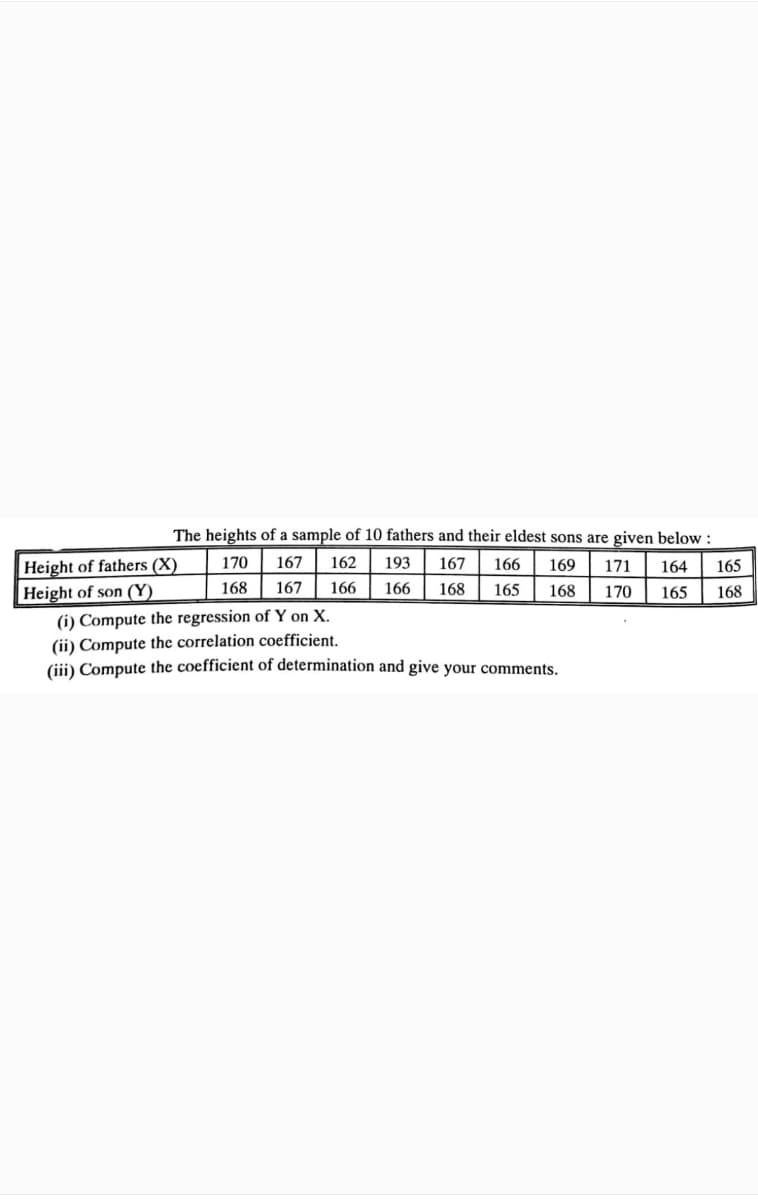
The heights of a sample of 10 fathers and their eldest sons are given below : Height of fathers (X) Height of son (Y) 170 167 162 193 167 166 169 171 164 165 168 167 166 166 168 165 168 170 165 168 (i) Compute the regression of Y on X. (ii) Compute the correlation coefficient. (iii) Compute the coefficient of determination and give your comments.


Q: he following data shows the dexterity test scores of five assembly-line employees of Dimples Company…
A: Since you have asked multiple questions, we will solve the first question for you. If you want any…
Q: The results of a sample of 7 data points are presented below in terms of the Average Daily…
A: Given data: Average daily temperature (x) Average monthly precipitation (y) 86 3.4 81 1.8…
Q: The grades of a tutorial class of 8 students on midterm report and final examination are as shown…
A: We want to find mean of Y and X , Sx and Sy ,Pearson correlation Note:According to bartleby experts…
Q: sider the following data for a dependent variable y and two independent variables, x, and x,. X1 x2…
A: Solution: Given information: n= 10 observation k= 2 independent variables SST = 14995.6 SSR=…
Q: ta. b) Assuming a 5% level of significance, use hypothesis testing and the linear correlation…
A: Here heights (in inches) is an explanatory variable (x) and weights (in pounds) is predicted…
Q: Given are five observations for two variables, x and y. x 3 12 6 20 14 y 65 50 65 15 18 a. Develop a…
A: From given data, X Y X*Y X*X Y*Y 3 65 195 9 4225 12 50 600 144 2500 6 65 390 36 4225 20…
Q: The final test and exam averages for 20 randomly selected students taking a course in engineering…
A: Since you have posted a question with multiple sub-parts, we will solve first three sub- parts for…
Q: Listed below are costs (in dollars) of air-fares for different airlines from New York City to San…
A: Hii ! Thanks for posting the question. Since your question has more than three subparts , we have…
Q: For a sample of 8 employees, a personnel director has collected the following data on ownership of…
A: As per our guidelines we can solve first three subpart and rest can be reposted. Solution-: X=Years…
Q: A manufacturer of optical lenses has the following data on the cost per unit of a certain custom…
A:
Q: Calculate the co-efficient of correlation and the lines of regression for the following data: 1 2 3…
A: Given that X Y 1 9 2 8 3 10 4 12 5 11 6 13 7 14 8 16 9 15
Q: 139 264 278 470 569 304 675 271 162 Y 94 222 241 428 500 275 394 232 | 133 а) Compute the…
A: x y u v u2 v2 uv 139 94 -361 -406 130321 164836 146566 264 222 -236 -278 55696 77284 65608 278…
Q: 1. Consider the following data of the number of hours 12 students spent online during the weekend…
A: (a) Use EXCEL to obtain the value correlation coefficient r: EXCEL procedure: Go to EXCEL Go…
Q: Subject Weight [Ib] Hg] 1 165 130 2 167 133 3 180 150 4 155 128 5 212 151 6 175 146 7 190 150 8 210…
A:
Q: The heights of a sample of 10 fathers and their eldest sons are given below : 167 162 Height of…
A:
Q: In an attempt to assess the effect of the student's score in the admission test to their academic…
A: The provided information is Sore in admission test x Grade y xy x2 52 80 4160 2704 61 78…
Q: In a population of snakes, researchers caught and measured ten adult females. Their body lengths (X)…
A: Hello! As you have posted more than 3 sub parts, we are answering the first 3 sub-parts. In case…
Q: An engineering student wants to study the impact of temperature and humidity on yield. The following…
A: Since you have posted question with multiple subparts,we will solve first three subparts for you.To…
Q: The marks obtained by 10 students in statistics (x) and algebra (y) are as follows: Table 6 88 82 73…
A: Correlation Coefficient: Let (x1, y1), (x2, y2), ... , (xn, yn) be n set of observations for the…
Q: Consider the following data set z represents the month, y represents the number of dialysis patients…
A: Given: X represents the month Y represents the number of dialysis patients
Q: Consider the following data for a dependent variable y and two independent variables, x, and x,. X1…
A: The statistical software output for this problem is given below: Hence,a) Hypotheses: Option C…
Q: The following table displays the mathematics test scores for a random sample of college students,…
A:
Q: Data on pollution and cost of medical care for elderly people are given in the following table.…
A: Enter the data in Excel.
Q: The following data on the percentage of the high-performance radial tires made by a certain…
A: Given n=8
Q: t is believed that standardized test scores, such as SAT, is a good predictor of first-year college…
A: Given information: The data is provides as follows: Students scores(x) Students GPA(y) x⋅y x2…
Q: The following table gives the ages and blood pressure of 9 women. Age (X) : 56 42 36 47 49 42 60 72…
A: From given data, X Y X*Y X*X Y*Y 56 147 8232 3136 21609 42 125 5250 1764 15625 36 118 4248…
Q: 1. For the sample data Scatter Plot 10 9 8 7 4. 3 1 1 5 7 8. 1 3 5 8 y 2 4 6 a. Based on the scatter…
A: a. Scatterplot is a graphical representation between two variables, where each of the points of the…
Q: The grades of a class of 9 students on a midterm report (x) and on the final examination (y) are as…
A: Note: Hi there! Thank you for posting the question. As there are multiple sub parts, according to…
Q: In a population of snakes, researchers caught and measured ten adult females. Their body lengths (X)…
A: Since you have asked multiple question, according to our guidelines we will solve the first question…
Q: The following data is representative of that reported in the article "An Experimental Correlation of…
A:
Q: Given the following data set, 10 8 13 9 11 14 6 4 12 7 5 9.14 8.14 8.74 8.77…
A: Let the fitted line be yi^=a^+b^xi.Then,b^=n∑i=1nxiyi-∑i=1nxi∑i=1nyin∑i=1nxi2-∑i=1nxi2 and…
Q: Consider the following data for a dependent variable y and two independent variables, x, and x,. X1…
A: Since you have posted a question with multiple sub-parts, we will solve first three subparts for…
Q: Run a regression analysis on the following bivariate set of data with y as the response variable. x…
A: The independent variable is x. The dependent variable is y. We have to predict the explanatory…
Q: Listed Below are amounts of bills for dinner and the amounts of tips thet were left. is there…
A: Note: Thank you for the question. Since multiple subparts are posted, according to our policy, we…
Q: The following table gives the ages and blood pressure of 9 women. Age (X) : 56 42 36 47 49 42 60 72…
A: From given data, X Y X*Y X*X Y*Y 56 147 8232 3136 21609 42 125 5250 1764 15625 36 118 4248…
Q: The following are the number of grams of water and the number of grams of carbohydrates for a random…
A: Since you have asked multiple subparts, we will solve first three subparts for you. To get remaining…
Q: Consider the following data for a dependent variable y and two independent variables, x1 and x2. X1…
A: The hypothesis testing for significant relationship is done using the F-test. The F-test statistic…
Q: An engineering student wants to study the impact of temperature and humidity on yield. The following…
A: (a) Use EXCEL to obtain the value correlation coefficient r: EXCEL procedure: Go to EXCEL Go…
Q: The following table lists the ages (in years) and the prices (in thousands of dollars) for a sample…
A:
Q: The table below summarizes x and y values. Find the sample correlation coefficient, rxy using the…
A: The data shows the x and y values to calculate the sample correlation coefficient.
Q: Given are five observations for two variables, x and y. x 3 12 6 20 14 y 65 50 65 15 18 a. Develop a…
A: We can plot scatter diagram manually or in Excel. And it is easier to plot excel than manually. So,…
Q: An engineering student wants to study the impact of temperature and humidity on yield. The following…
A: solution
Q: a) Given the data below on students' scores, derive the regression equation b) Calculate Spearman's…
A:
Q: Consider the following data for a dependent variable y and two independent variables, X1 and X2. X1…
A: There are two independent variables which are named as x1 and x2. The dependent variable is y. We…
Q: A random sample of 11 students produced the following data, where x is the hours spent per month…
A:
Q: The following table lists the midterm and final exam scores for seven students in a statistics…
A: In this case, final exam scores is predicted on the basis of midterm exam scores. The final exam…
Q: Calculate the co-efficient of correlation and the lines of regression for the following data: 1 2 3…
A:
Q: An engineering student wants to study the impact of temperature and humidity on yield. The following…
A: a) given data X Y X*Y X*X X*Y 112 40 4480 12544 1600 118 45 5310 13924 2025…
Q: A researcher intends to conduct a multiple regression on the following data set where YY is the…
A:

Step by step
Solved in 2 steps with 1 images

- Data on pollution and cost of medical care for elderly people are given in the following table. Region Pollution Cost of Medical Care North 30.0 915 Upper South 31.8 891 Deep South 32.1 968 West South 26.8 972 Big Sky 30.4 952 West 40.0 899 Compute the regression line and determine the residuals Compute the correlation coefficient. Does the value of r indicate that the linear relationship is strong? Are there any unusual feature of the residual plot?For the data given in the table below, find the linear correlation coefficient r and the least-squares regression line x y ------- 1 18 3 13 3 9 6 6 7 4 -------A random sample of nonindustrialized countries was selected, and the life expectancy in years is listed for both men and women. Men 61.7 42.8 72.6 57.9 55.4 62.1 Women 50.4 74.2 75.3 75.4 49.1 65.2 The correlation coefficient for the data is =r−0.003 and =α0.05. Should regression analysis be done? Now Find the equation of the regression line. Round the coefficients to at least three decimal places. =y′+abx =a =b Now Find women's life expectancy in a country where men's life expectancy =60 years. Round your answer to at least three decimal places. Women's life expectancy is ____ years.
- The ages (X) of ten second-hand cars and their km values (Y) are given below.a) Calculate the correlation coefficient between X and Y.b) Calculate the coefficients of the regression line of the Y with respect to X.c) Estimate the km value of a 5.0 year old car. X and Y values given in the picture.The average gasoline price per gallon (in cities) and the cost of a barrel of oil are shown below for a random selection of weeks in 2015 . Oil ( $ ) Gasoline ( $ ) 47.79 2.638 44.62 2.636 81.08 2.944 43.67 2.528 40.58 2.623 48.64 2.682 The correlation coefficient for the data is =r0.954 and =α0.01. Should regression analysis be done? Find the equation of the regression line. Round the coefficients to at least three decimal places. =y′+abx =a =b Find the cost of gasoline when oil is $57 a barrel. Round the answer to at least three decimal places. When oil is $57 a barrel, gas costs $ per gallon.A study of the amount of rainfall and the quantity of air pollution removed produced the following data shown in table below: Daily Rainfall x (0.01 cm) Particulate Removed y (μg/m3) 7 126 7.9 129.3 7.5 125.3 9.2 120.2 10.8 116.7 5.8 119.2 5.6 138.7 2.7 147.5 9.2 110.3 Compute and interpret the coefficient of determination, and coefficient of correlation for the given data. What will be the regression equation, when swapped depended and independent variable
- The following table gives the data for the average temperature and the snow accumulation in several small towns for a single month. Determine the equation of the regression line, yˆ=b0+b1xy^=b0+b1x. Round the slope and y-intercept to the nearest thousandth. Then determine if the regression equation is appropriate for making predictions at the 0.01 level of significance. Critical Values of the Pearson Correlation Coefficient Average Temperatures and Snow Accumulations Average Temperature (℉℉) 42 27 22 39 44 21 27 18 32 36 Snow Accumulation (in.in.) 6 11 22 8 12 27 27 20 12 6 Regression equation y=_______________ Is the equation appropriate?4.For a sample of 12 observations, a businessman wants to regress the price (in dollar) of the laptop (Y) on the processor's speed (X). The summary results of the observations are given below. Σx = 19.8 , Σy = 24798, Σxy = 431882 Σx^2 = 33.88, Σγ^2 = 57365692 (b)Find the fitted regression line of the price of laptop on processor speed. (c) Find the predicted price of the laptop (y) for the processor speed x-1.9. (d) Compute the coefficient of determination and comment.The following table shows the number of full-time faculty that WVU has on staff throughout the years.Year # of Faculty2003 12102007 13302009 14202013 14702017 15002018 1660 (A) Find the equation of the regression line that represents the number of full-time faculty, F , as a function of x years since 2000. (round the regression coefficients to two decimal places)F(x) =_______________________? (B) What is the correlation coefficient (r-value) for the regression model? (Round your answer to three decimal places)r =________? (C) Given the value of r , does the regression line model the data well? That is, does the equation do a good job of modeling the data? 1.)No, the r-value is high, meaning the data can't be modeled using a line2.)Yes, the r-value is low, meaning the data can be modeled using a line 3.)No, the r-value is low, meaning the data can't be modeled using a line4.)Yes, the r-value is high, meaning the data can be modeled using a line Answer______________? (D) Using the…
- Listed below are costs (in dollars) of air-fares for different airlines from New York City to San Francisco. The costs are base on tickets purchased 30 days in advance and on day in advance. 30 days x 240 250 254 284 288 328 290 One day y 556 514 587 843 728 988 536 Compute the correlation coefficient. Compute the slope of the linear regression line. Compute the y-intercept of the linear regression Use the equation of the regression line(and parts b. and c.) to give a point estimate of the cost of a ticket purchased one day in advance, given the ticket cost of $310 if purchased 30 days in advance of the flight. Give a 95% confidence interval for y when x is $310.The following table gives the data for the average temperature and the snow accumulation in several small towns for a single month. Determine the equation of the regression line, yˆ=b0+b1x. Round the slope and y-intercept to the nearest thousandth. Then determine if the regression equation is appropriate for making predictions at the 0.01 level of significance. Critical Values of the Pearson Correlation Coefficient Average Temperatures and Snow Accumulations Average Temperature (℉) 42 27 22 39 44 21 27 18 32 36 Snow Accumulation (in.) 6 11 22 8 12 27 27 20 12 61. Plot the data points on a scatter diagram. 2. Determine the equation of the regression line and find Pearson product-moment correlation coefficient. 3. Determine the point estimate of y at x = 5.5