O The standard normal (2) distribution should be used The Student's t distribution should be used Determine the test statistic for the hypothesis test. Round the solution to four decimal places. Determine the p-value (range) for the hypothesis test. Op-value < 0.0005 O 0.0005 < p-value < 0.005 O 0.005 p-value < 0.01 O 0.01 < p-value < 0.025 O 0.025 < p-value < 0.05 O 0.05 < p-value < 0.10 Op-value > 0.10 Determine the appropriate conclusion for this hypothesis test. O The sample data provide sufficient evidence to reject the alternative hypothesis that the average range of this electric car is less than 240 miles and thus we conclude that the true range of this electric car is likely 240 miles. O The sample data do not provide sufficient evidence to reject the alternative hypothesis that the average range of this electric car is less than 240 miles and thus we conclude that the true range of this electric car is likely less than 240 miles. ** 75°F
O The standard normal (2) distribution should be used The Student's t distribution should be used Determine the test statistic for the hypothesis test. Round the solution to four decimal places. Determine the p-value (range) for the hypothesis test. Op-value < 0.0005 O 0.0005 < p-value < 0.005 O 0.005 p-value < 0.01 O 0.01 < p-value < 0.025 O 0.025 < p-value < 0.05 O 0.05 < p-value < 0.10 Op-value > 0.10 Determine the appropriate conclusion for this hypothesis test. O The sample data provide sufficient evidence to reject the alternative hypothesis that the average range of this electric car is less than 240 miles and thus we conclude that the true range of this electric car is likely 240 miles. O The sample data do not provide sufficient evidence to reject the alternative hypothesis that the average range of this electric car is less than 240 miles and thus we conclude that the true range of this electric car is likely less than 240 miles. ** 75°F

Holt Mcdougal Larson Pre-algebra: Student Edition 2012
1st Edition
ISBN:9780547587776
Author:HOLT MCDOUGAL
Publisher:HOLT MCDOUGAL
Chapter11: Data Analysis And Probability
Section: Chapter Questions
Problem 8CR

Related questions
Question
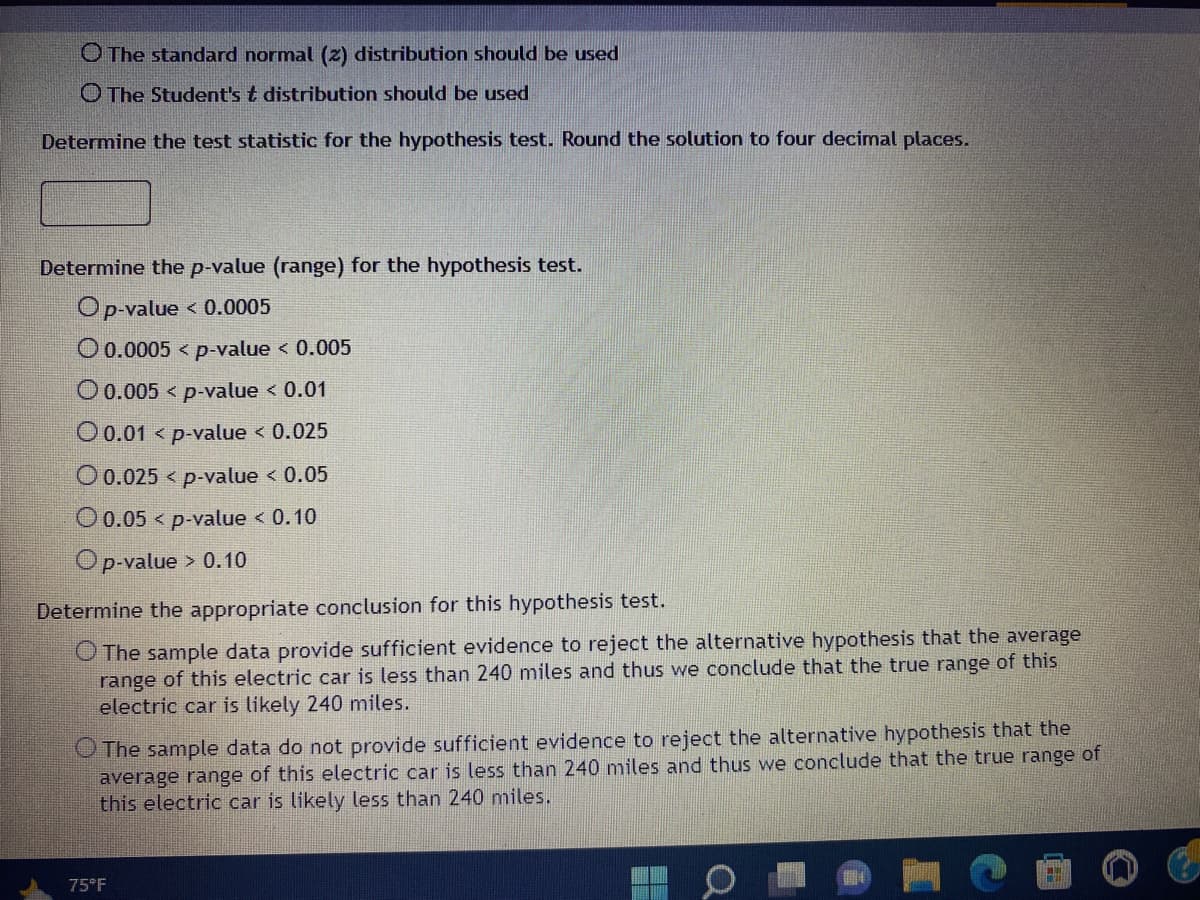
Transcribed Image Text:O The standard normal (2) distribution should be used
The Student's t distribution should be used
Determine the test statistic for the hypothesis test. Round the solution to four decimal places.
Determine the p-value (range) for the hypothesis test.
Op-value < 0.0005
O 0.0005 p-value < 0.005
O 0.005
p-value < 0.01
O 0.01 < p-value < 0.025
O 0.025 < p-value < 0.05
O 0.05 < p-value < 0.10
Op-value > 0.10
Determine the appropriate conclusion for this hypothesis test.
O The sample data provide sufficient evidence to reject the alternative hypothesis that the average
range of this electric car is less than 240 miles and thus we conclude that the true range of this
electric car is likely 240 miles.
The sample data do not provide sufficient evidence to reject the alternative hypothesis that the
average range of this electric car is less than 240 miles and thus we conclude that the true range of
this electric car is likely less than 240 miles.
ww
75°F
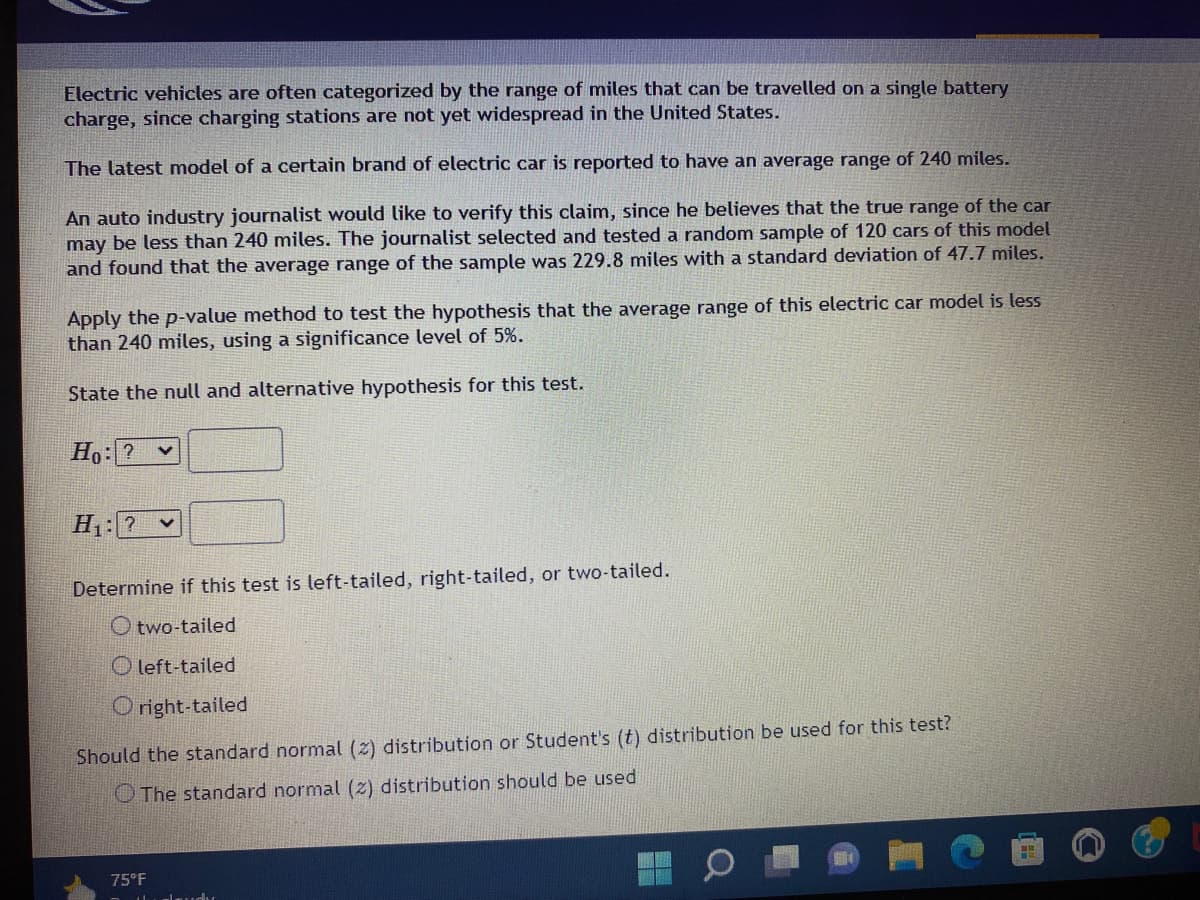
Transcribed Image Text:Electric vehicles are often categorized by the range of miles that can be travelled on a single battery
charge, since charging stations are not yet widespread in the United States.
The latest model of a certain brand of electric car is reported to have an average range of 240 miles.
An auto industry journalist would like to verify this claim, since he believes that the true range of the car
may be less than 240 miles. The journalist selected and tested a random sample of 120 cars of this model
and found that the average range of the sample was 229.8 miles with a standard deviation of 47.7 miles.
Apply the p-value method to test the hypothesis that the average range of this electric car model is less
than 240 miles, using a significance level of 5%.
State the null and alternative hypothesis for this test.
Ho: ? V
H₁: ?
V
Determine if this test is left-tailed, right-tailed, or two-tailed.
Otwo-tailed
Oleft-tailed
Oright-tailed
Should the standard normal (2) distribution or Student's (t) distribution be used for this test?
The standard normal (2) distribution should be used
75°F
Expert Solution
This question has been solved!
Explore an expertly crafted, step-by-step solution for a thorough understanding of key concepts.

Step by step
Solved in 2 steps with 2 images

Recommended textbooks for you
Holt Mcdougal Larson Pre-algebra: Student Edition…
Algebra
ISBN:
9780547587776
Author:
HOLT MCDOUGAL
Publisher:
HOLT MCDOUGAL

Glencoe Algebra 1, Student Edition, 9780079039897…
Algebra
ISBN:
9780079039897
Author:
Carter
Publisher:
McGraw Hill
Holt Mcdougal Larson Pre-algebra: Student Edition…
Algebra
ISBN:
9780547587776
Author:
HOLT MCDOUGAL
Publisher:
HOLT MCDOUGAL
Glencoe Algebra 1, Student Edition, 9780079039897…
Algebra
ISBN:
9780079039897
Author:
Carter
Publisher:
McGraw Hill