5. The thicknesses of n = 41 glass sheets made using process A are mea- sured and the statistics = 3.04 mm and sx = 0.124 mm are obtained. In addition, the thicknesses of m= 41 glass sheets made using process B are measured and the statistics y = 3.12 mm and sy = 0.137 mm are obtained. Assuming that the two population variances are equal, answer the following questions. a) Does a two-sided hypothesis test with size a = 0.01 accept or reject the null hypothesis that the two processes produce glass sheets with equal thicknesses on average? b) What is a two-sided 99% confidence interval for the difference in the average thicknesses of sheets produced by the two processes? c) Is there enough evidence to conclude that the average thicknesses. of sheets produced by the two processes are different? d) Construct a 90% confidence interval for the ratio of the variances of the thicknesses of glass sheets produced by the two processes.
5. The thicknesses of n = 41 glass sheets made using process A are mea- sured and the statistics = 3.04 mm and sx = 0.124 mm are obtained. In addition, the thicknesses of m= 41 glass sheets made using process B are measured and the statistics y = 3.12 mm and sy = 0.137 mm are obtained. Assuming that the two population variances are equal, answer the following questions. a) Does a two-sided hypothesis test with size a = 0.01 accept or reject the null hypothesis that the two processes produce glass sheets with equal thicknesses on average? b) What is a two-sided 99% confidence interval for the difference in the average thicknesses of sheets produced by the two processes? c) Is there enough evidence to conclude that the average thicknesses. of sheets produced by the two processes are different? d) Construct a 90% confidence interval for the ratio of the variances of the thicknesses of glass sheets produced by the two processes.

Glencoe Algebra 1, Student Edition, 9780079039897, 0079039898, 2018
18th Edition
ISBN:9780079039897
Author:Carter
Publisher:Carter
Chapter10: Statistics
Section10.4: Distributions Of Data
Problem 19PFA

Related questions
Question
Hi, Can you please help me solve this problem of Probability Theory and Statistics
Thank you in advance!
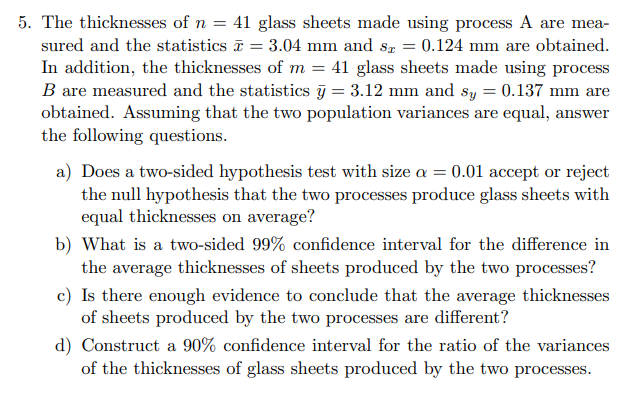
Transcribed Image Text:5. The thicknesses of n = 41 glass sheets made using process A are mea-
sured and the statistics = 3.04 mm and sx = 0.124 mm are obtained.
In addition, the thicknesses of m = 41 glass sheets made using process
B are measured and the statistics y = 3.12 mm and sy = 0.137 mm are
obtained. Assuming that the two population variances are equal, answer
the following questions.
a) Does a two-sided hypothesis test with size a = 0.01 accept or reject
the null hypothesis that the two processes produce glass sheets with
equal thicknesses on average?
b) What is a two-sided 99% confidence interval for the difference in
the average thicknesses of sheets produced by the two processes?
c) Is there enough evidence to conclude that the average thicknesses
of sheets produced by the two processes are different?
d) Construct a 90% confidence interval for the ratio of the variances
of the thicknesses of glass sheets produced by the two processes.
Expert Solution
This question has been solved!
Explore an expertly crafted, step-by-step solution for a thorough understanding of key concepts.

Step by step
Solved in 2 steps

Recommended textbooks for you
Glencoe Algebra 1, Student Edition, 9780079039897…
Algebra
ISBN:
9780079039897
Author:
Carter
Publisher:
McGraw Hill
Glencoe Algebra 1, Student Edition, 9780079039897…
Algebra
ISBN:
9780079039897
Author:
Carter
Publisher:
McGraw Hill