of the tomato was recorded. Plant D 2.5 3.0 4.5 7.7 3.5 4.0 1.0 3.9 1.5 4.4 2.0 5.8 Y 6.6 7.0 7.1 7.3 a. Plot a scatter diagram of yield against amount of fertilizer. b. Calculate the regression equation line and explain the value obtained. C. Estimate the yield of a plant treated weekly with 3.2 grams of fertilizer.
of the tomato was recorded. Plant D 2.5 3.0 4.5 7.7 3.5 4.0 1.0 3.9 1.5 4.4 2.0 5.8 Y 6.6 7.0 7.1 7.3 a. Plot a scatter diagram of yield against amount of fertilizer. b. Calculate the regression equation line and explain the value obtained. C. Estimate the yield of a plant treated weekly with 3.2 grams of fertilizer.

Glencoe Algebra 1, Student Edition, 9780079039897, 0079039898, 2018
18th Edition
ISBN:9780079039897
Author:Carter
Publisher:Carter
Chapter10: Statistics
Section10.6: Summarizing Categorical Data
Problem 26PPS

Related questions
Question
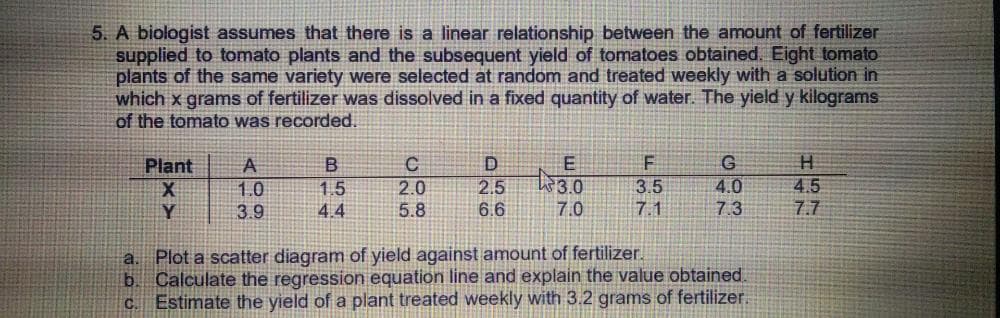
Transcribed Image Text:5. A biologist assumes that there is a linear relationship between the amount of fertilizer
supplied to tomato plants and the subsequent yield of tomatoes obtained. Eight tomato
plants of the same variety were selected at random and treated weekly with a solution in
which x grams of fertilizer was dissolved in a fixed quantity of water. The yield y kilograms
of the tomato was recorded.
Plant
A
3.0
4.0
7.3
2.5
3.5
1.5
4.4
4.5
7.7
1.0
2.0
Y
3.9
5.8
6.6
7.0
7.1
a. Plot a scatter diagram of yield against amount of fertilizer.
b. Calculate the regression equation line and explain the value obtained.
C. Estimate the yield of a plant treated weekly with 3.2 grams of fertilizer.
Expert Solution
This question has been solved!
Explore an expertly crafted, step-by-step solution for a thorough understanding of key concepts.

This is a popular solution!

Trending now
This is a popular solution!

Step by step
Solved in 2 steps with 2 images

Recommended textbooks for you
Glencoe Algebra 1, Student Edition, 9780079039897…
Algebra
ISBN:
9780079039897
Author:
Carter
Publisher:
McGraw Hill

Big Ideas Math A Bridge To Success Algebra 1: Stu…
Algebra
ISBN:
9781680331141
Author:
HOUGHTON MIFFLIN HARCOURT
Publisher:
Houghton Mifflin Harcourt
Glencoe Algebra 1, Student Edition, 9780079039897…
Algebra
ISBN:
9780079039897
Author:
Carter
Publisher:
McGraw Hill
Big Ideas Math A Bridge To Success Algebra 1: Stu…
Algebra
ISBN:
9781680331141
Author:
HOUGHTON MIFFLIN HARCOURT
Publisher:
Houghton Mifflin Harcourt