Olestra is a fat substitute approved by the FDA for use in snack foods. Because there have been anecdotal reports of gastrointestinal problems associated with olestra consumption, a randomized, double-blind, placebo-controlled experiment was carried out to compare olestra potato chips to regular potato chips with respect to Gl symptoms ("Gastrointestinal Symptoms Following Consumption of Olestra or Regular Triglyceride Potato Chips," J. of the Amer. Med. Assoc., 1998: 150 152). Among 529 individuals in the control group (no olestra), 17.6% experienced an adverse Gil event, whereas among the 563 individuals in the olestra treatment group, 15.8% experienced such an event. Compute a 98% confidence interval for the difference between the two true proportions. How do you classify the problem? QIt is a problem in the area of Probability, since the question is about computing a probability. It is a problem in the area of Descriptive Statistics, since we need to compute the sample means and sample standard deviations. It is a problem in the area of Inferential Statistics, since it is about drawing conclusions about populations based on information from samples. It is a problem in the area of Statistics.
Olestra is a fat substitute approved by the FDA for use in snack foods. Because there have been anecdotal reports of gastrointestinal problems associated with olestra consumption, a randomized, double-blind, placebo-controlled experiment was carried out to compare olestra potato chips to regular potato chips with respect to Gl symptoms ("Gastrointestinal Symptoms Following Consumption of Olestra or Regular Triglyceride Potato Chips," J. of the Amer. Med. Assoc., 1998: 150 152). Among 529 individuals in the control group (no olestra), 17.6% experienced an adverse Gil event, whereas among the 563 individuals in the olestra treatment group, 15.8% experienced such an event. Compute a 98% confidence interval for the difference between the two true proportions. How do you classify the problem? QIt is a problem in the area of Probability, since the question is about computing a probability. It is a problem in the area of Descriptive Statistics, since we need to compute the sample means and sample standard deviations. It is a problem in the area of Inferential Statistics, since it is about drawing conclusions about populations based on information from samples. It is a problem in the area of Statistics.

MATLAB: An Introduction with Applications
6th Edition
ISBN:9781119256830
Author:Amos Gilat
Publisher:Amos Gilat
Chapter1: Starting With Matlab
Section: Chapter Questions
Problem 1P

Related questions
Question
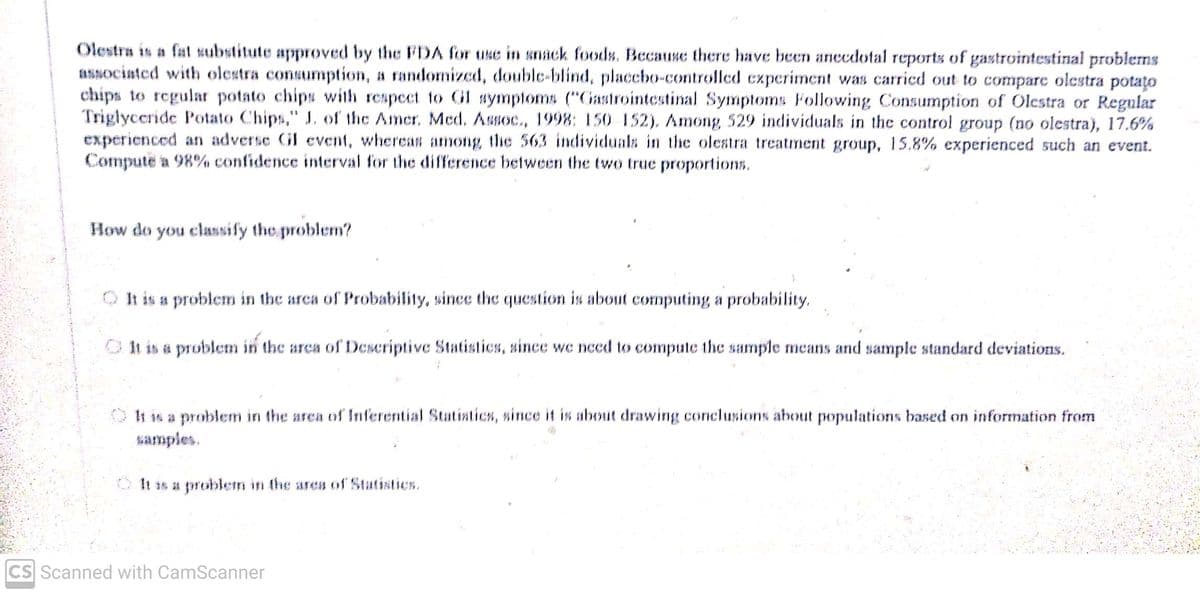
Transcribed Image Text:Olestra is a fat substitute approved by the FDA for use in snack foods. Because there have been anecdotal reports of gastrointestinal problems
associated with olestra consumption, a randomized, double-blind, placebo-controlled experiment was carried out to compare olestra potato
chips to regular potato chips with respect to GI symptoms ("Gastrointestinal Symptoms Following Consumption of Olestra or Regular
Triglyceride Potato Chips," J. of the Amer. Med. Assoc., 1998: 150 152), Among 529 individuals in the control group (no olestra), 17.6%
experienced an adverse GI event, whereas among the 563 individuals in the olestra treatment group, 15.8% experienced such an event.
Compute a 98% confidence interval for the difference between the two true proportions.
How do you classify the problem?
It is a problem in the area of Probability, since the question is about computing a probability.
It is a problem in the area of Descriptive Statistics, since we need to compute the sample means and sample standard deviations.
It is a problem in the area of Inferential Statistics, since it is about drawing conclusions about populations based on information from
It is a problem in the area of Statistics.
CS Scanned with CamScanner
Expert Solution
This question has been solved!
Explore an expertly crafted, step-by-step solution for a thorough understanding of key concepts.

This is a popular solution!

Trending now
This is a popular solution!

Step by step
Solved in 2 steps

Recommended textbooks for you
MATLAB: An Introduction with Applications
Statistics
ISBN:
9781119256830
Author:
Amos Gilat
Publisher:
John Wiley & Sons Inc

Probability and Statistics for Engineering and th…
Statistics
ISBN:
9781305251809
Author:
Jay L. Devore
Publisher:
Cengage Learning

Statistics for The Behavioral Sciences (MindTap C…
Statistics
ISBN:
9781305504912
Author:
Frederick J Gravetter, Larry B. Wallnau
Publisher:
Cengage Learning
MATLAB: An Introduction with Applications
Statistics
ISBN:
9781119256830
Author:
Amos Gilat
Publisher:
John Wiley & Sons Inc
Probability and Statistics for Engineering and th…
Statistics
ISBN:
9781305251809
Author:
Jay L. Devore
Publisher:
Cengage Learning
Statistics for The Behavioral Sciences (MindTap C…
Statistics
ISBN:
9781305504912
Author:
Frederick J Gravetter, Larry B. Wallnau
Publisher:
Cengage Learning

Elementary Statistics: Picturing the World (7th E…
Statistics
ISBN:
9780134683416
Author:
Ron Larson, Betsy Farber
Publisher:
PEARSON

The Basic Practice of Statistics
Statistics
ISBN:
9781319042578
Author:
David S. Moore, William I. Notz, Michael A. Fligner
Publisher:
W. H. Freeman

Introduction to the Practice of Statistics
Statistics
ISBN:
9781319013387
Author:
David S. Moore, George P. McCabe, Bruce A. Craig
Publisher:
W. H. Freeman